
Last analysis expected price to move higher for Wednesday’s session. Downwards movement invalidated the hourly wave counts.
However, downwards movement has breached the invalidation point for the first wave count for the DJIA. Although price remains above the invalidation point of the first wave count for the S&P 500 I consider this confirmation from the DJIA to be strong enough to now use the second wave count for the S&P 500 as the preferred and primary wave count.
Finally we have more clarity. I have a main wave count for you which now has a higher probability. At this stage I will also have an alternate for the S&P 500 until it is invalidated.
Click on the charts below to enlarge.
Primary Wave Count.
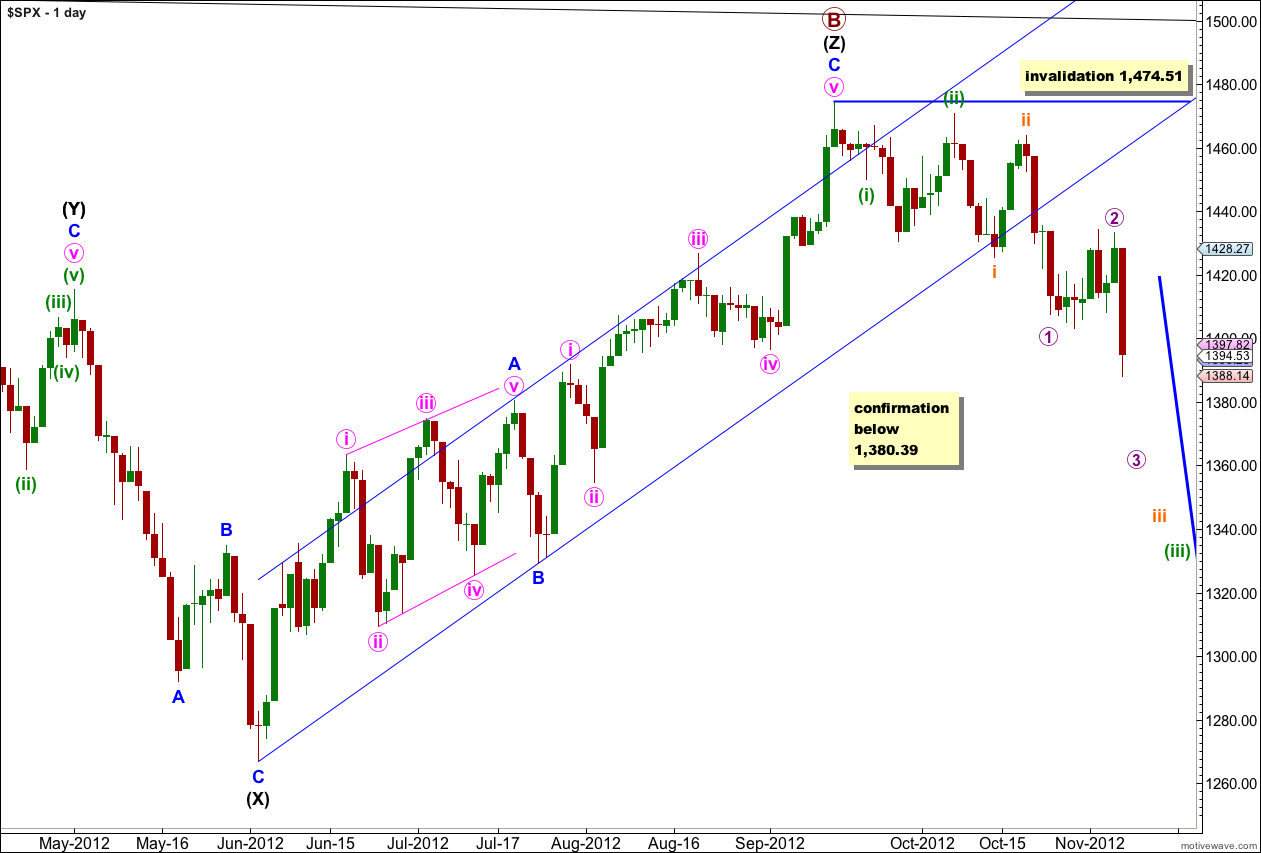
Today it looks more likely that we have recently seen a major trend change in the S&P 500 and the DJIA. The DJIA has confirmed a trend change, and so I would expect the S&P 500 to follow shortly with movement below 1,380.39.
The upper black line is the upper edge of a parallel channel drawn on the monthly chart. This area may have provided resistance.
The channel drawn about the zigzag of wave (Z) black using Elliott’s technique for a correction is very clearly breached. This is some indication that this wave count may be correct.
Within the new downwards trend no second wave correction may move beyond the start of the first wave. This wave count is invalidated with any movement above 1,474.51.
If we are in a new downwards trend we may have seen a series of overlapping first and second waves. The other structural possibility is a leading diagonal which looks less likely at this stage.
If price breaks below 1,380.39 then this wave count will increase significantly in probability. At that stage I would calculate downwards targets for you. To do so prior to confirmation would be premature.
At the monthly chart level this wave count has a primary wave B within a flat correction which is 140% the length of primary wave A. Primary wave C has recently begun and is extremely likely to make a new low below the end of Primary wave A at 1,074.77.
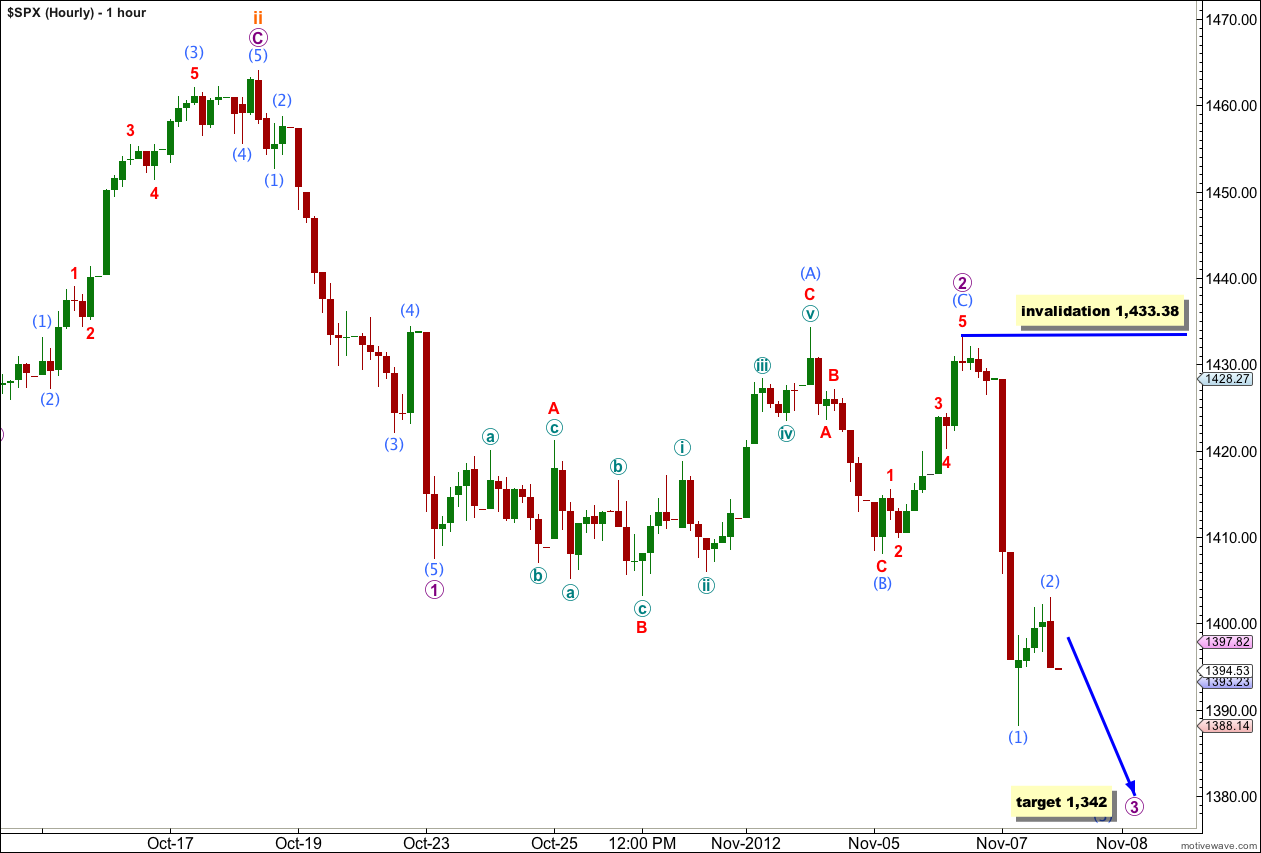
With a series of overlapping first and second waves complete this structure should be moving towards the middle of a third wave. Downwards movement should increase in momentum.
At 1,342 wave 3 purple would reach 1.618 the length of wave 1 purple.
Within wave 3 purple wave (2) aqua may not move beyond the start of wave (1) aqua. This wave count is invalidated with movement above 1,433.38 in the short term.
When wave (3) aqua is complete then the invalidation point may move lower to the end of wave (1) aqua at 1,388.14.
Movement below 1,380.39 would provide strong confidence in this wave count.
Alternate Wave Count.
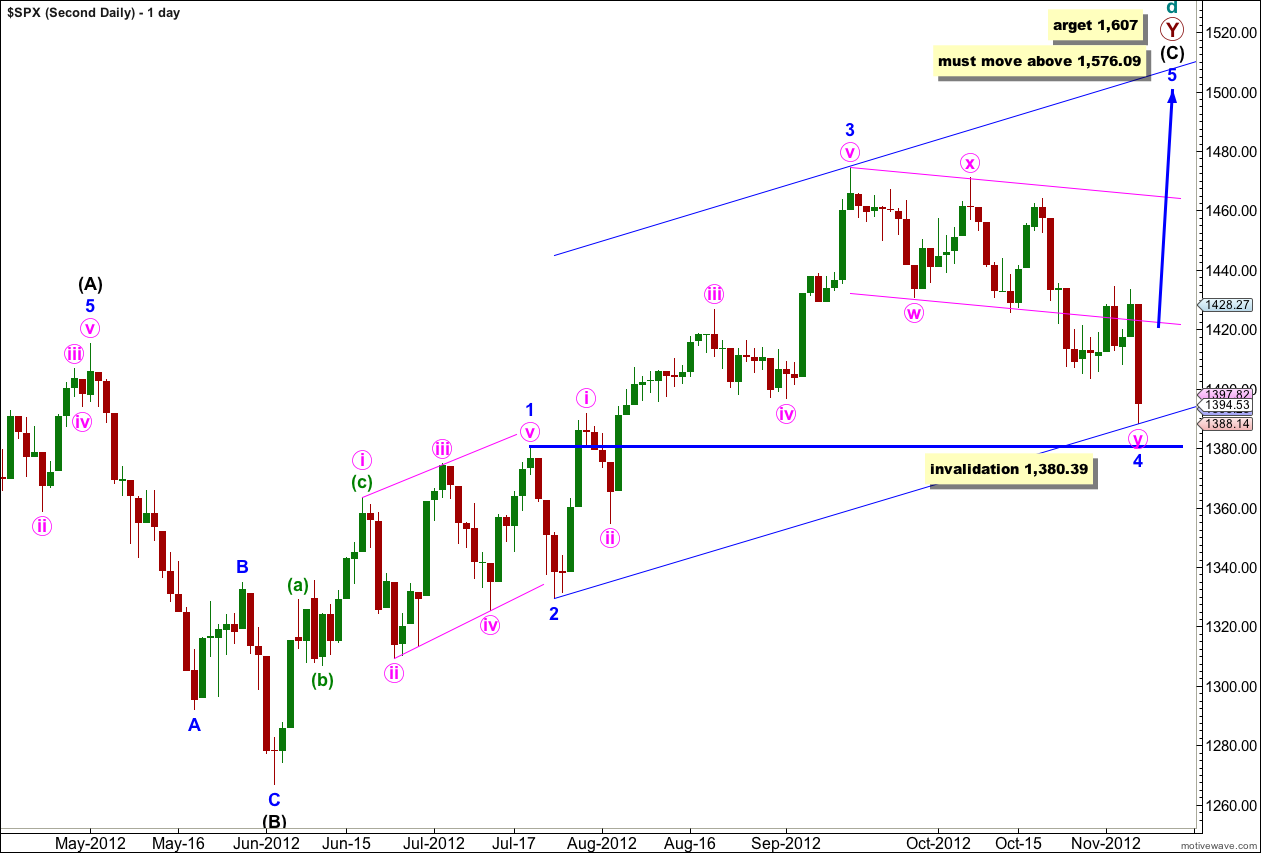
While price remains above 1,380.39 this wave count will remain valid for the S&P 500. For the DJIA this wave count is now invalidated.
At super cycle degree this wave count sees a very rare expanding triangle unfolding, and cycle wave d upwards within the triangle is a double zigzag which must move beyond the end of cycle wave b at 1,576.09.
Within the second zigzag of the double, primary wave Y, wave (C) black must unfold as a five wave structure.
Waves 1 through to 4 blue are complete. Wave 2 blue unfolded as a brief zigzag, and wave 4 blue was a double zigzag exhibiting alternation.
Further downwards movement for wave 4 blue may not move into wave 1 blue price territory. This wave count is invalidated with movement below 1,380.39.
At 1,607 wave (C) black would reach equality in length with wave (A) black.
Elliott’s second channeling technique may be used about this impulse of wave (C) black. The first trend line is drawn from the lows of 2 to 4 blue, then a parallel copy is placed upon the high of wave 3 blue. Wave 5 blue should end either mid way within the channel or about the upper edge.