
Last analysis expected upwards movement for the first wave count to begin Friday’s session to a short term target at 1,439, before price moved lower. Price reached up to 4.73 points short of the target before turning back down.
At this stage the first and second wave counts are now expecting the same direction next, for the short term. Thereafter, they should again diverge.
The first and second wave counts still have about an even probability at the monthly chart level. Members may review monthly charts here.
Click on the charts below to enlarge.
First Wave Count.
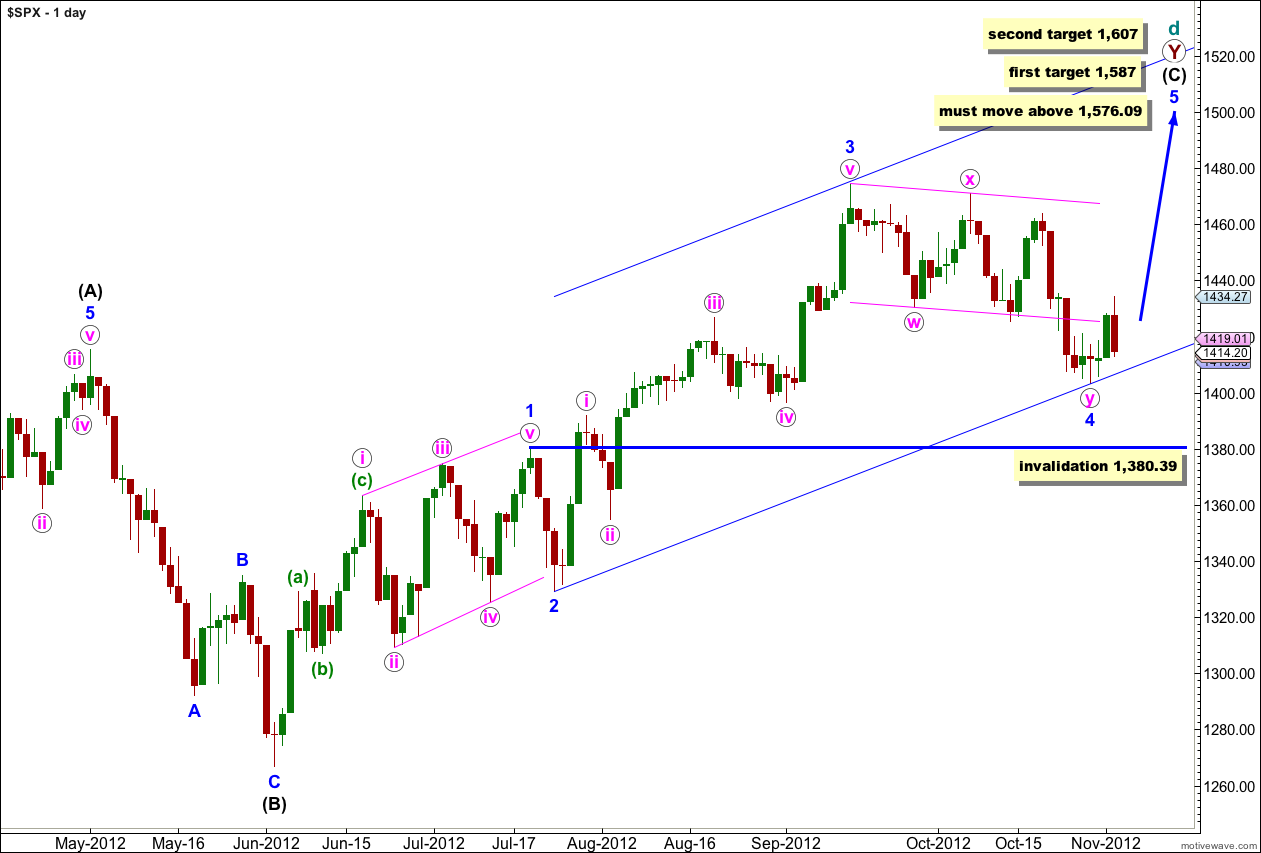
At super cycle degree this wave count sees a very rare expanding triangle unfolding, and cycle wave d upwards within the triangle is a double zigzag which must move beyond the end of cycle wave b.
Within the second zigzag of the double, primary wave Y, wave (C) black must unfold as a five wave structure.
Waves 1 through to 3 blue are complete. Wave 2 blue unfolded as a brief zigzag, and wave 4 blue looks like a double zigzag exhibiting alternation.
Further downwards movement for wave 4 blue may not move into wave 1 blue price territory. This wave count is invalidated with movement below 1,380.39.
At 1,587 wave 5 blue would reach 1.618 the length of wave 1 blue. If price passed through this first target we shall use the second.
At 1,607 wave (C) black would reach equality in length with wave (A) black.
Elliott’s second channeling technique may be used about this impulse of wave (C) black. The first trend line is drawn from the lows of 2 to 4 blue, then a parallel copy is placed upon the high of wave 3 blue. Wave 5 blue should end either mid way within the channel or about the upper edge.
If this wave count is invalidated with downwards movement below 1,380.39 then the second daily wave count would be correct. At that stage it would be difficult to see how a large expanding triangle could be unfolding. Movement below 1,266.74 would invalidate the expanding triangle scenario at the monthly chart level and at intermediate degree (please see monthly charts here for an explanation of the wave count at higher degrees).
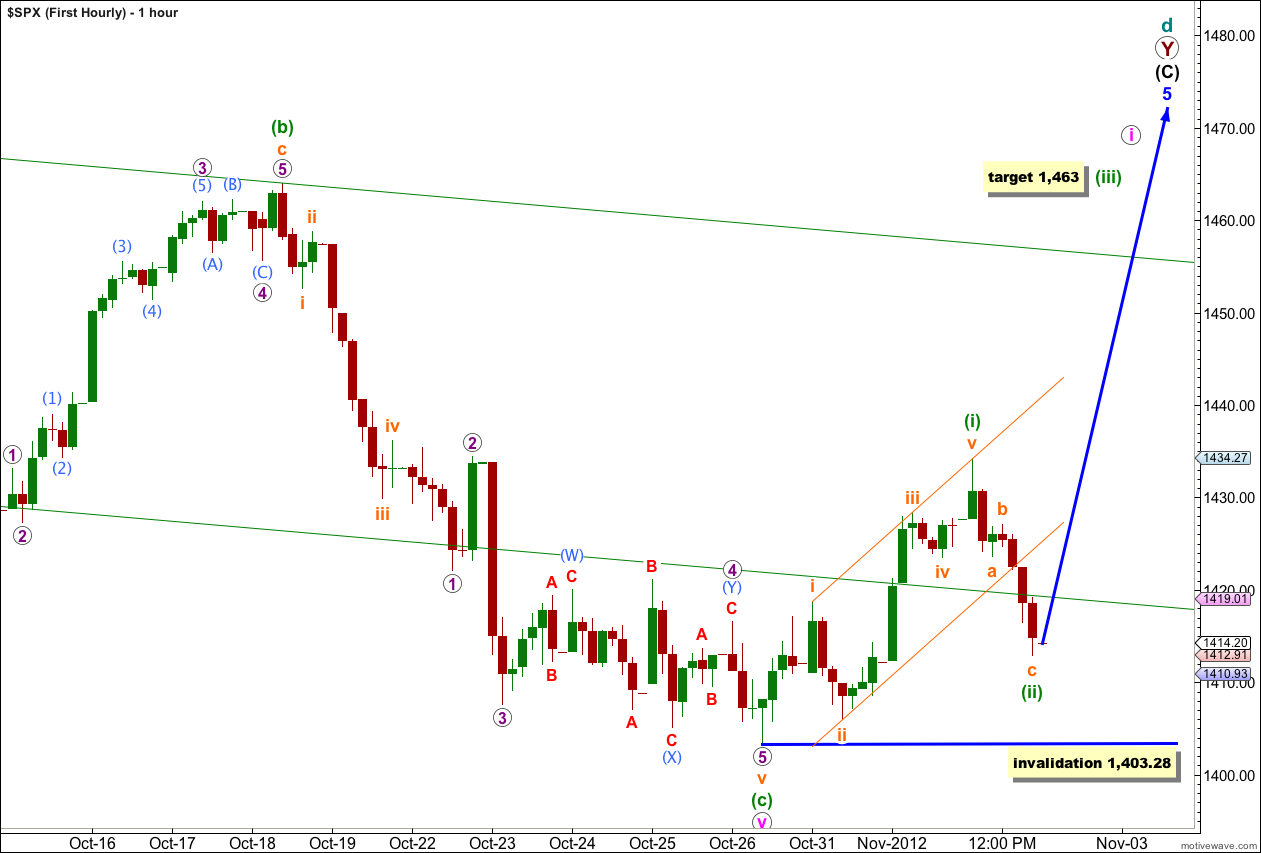
Upwards movement to begin Friday’s session fits this wave count perfectly. We now have a five up and so far a three down which indicates at least a short term trend change.
Ratios within wave (i) green are: wave iii orange has no Fibonacci ratio to wave i orange, and wave v orange has no Fibonacci ratio to either of wave i or iii orange.
Downwards movement for wave (ii) green so far subdivides nicely as a 5-3-5 zigzag. There is no Fibonacci ratio between waves a and c orange. Wave (ii) green is a 69% correction of wave (i) green.
When markets open on Monday any further downwards movement of wave c orange within wave (ii) green may not move beyond the start of wave (i) green. This wave count is invalidated with movement below 1,403.28.
At 1,463 wave (iii) green would reach 1.618 the length of wave (i) green.
This wave count expects upwards movement with an increase in momentum for Monday.
Second Wave Count.
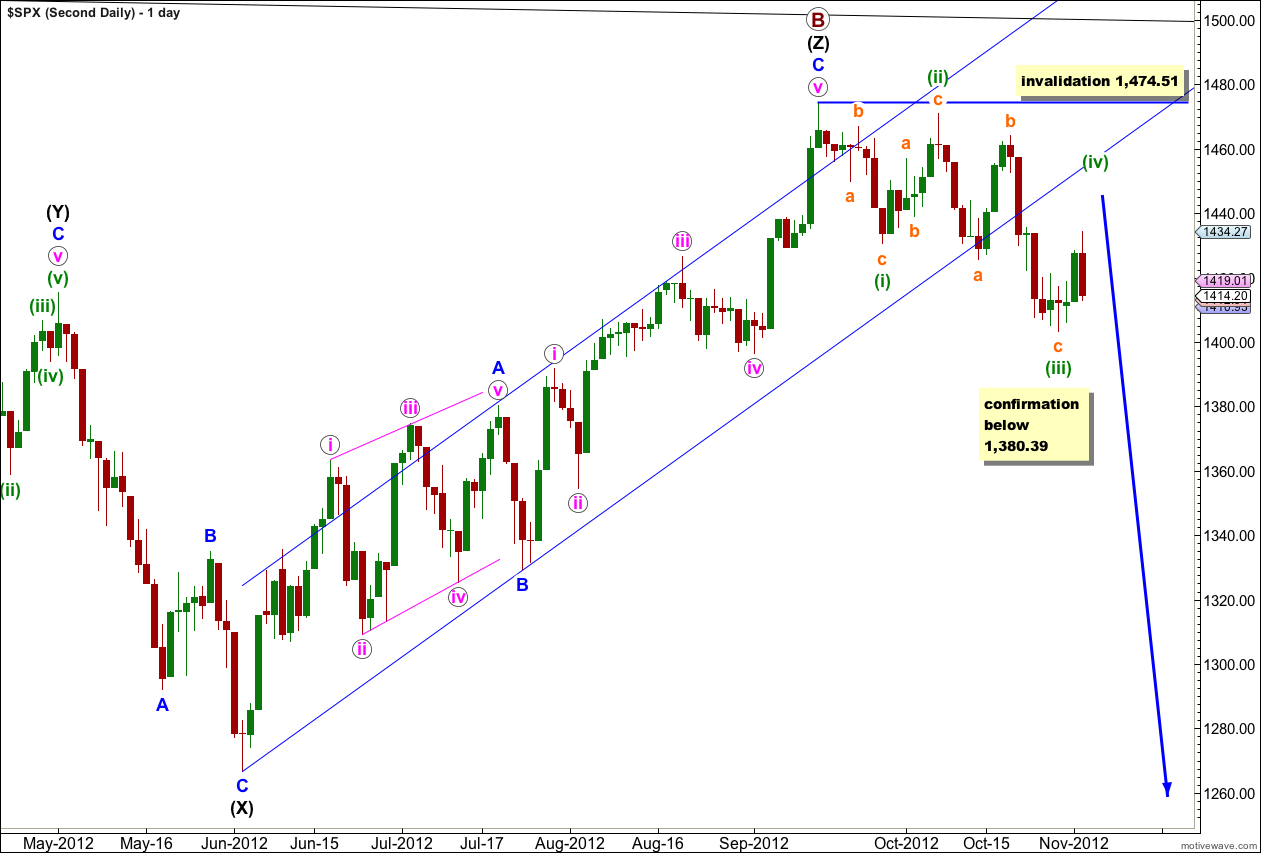
It remains possible that we have recently seen a major trend change in the S&P 500 and the DJIA. We should not place any confidence in this wave count prior to confirmation of a trend change with movement below 1,380.39.
We should always assume that the trend remains the same, until proven otherwise. At this stage we have a little indication of a trend change with a clear channel breach, but we will not have price confirmation until we see movement below 1,380.39 invalidating the first daily wave count.
The upper black line is the upper edge of a parallel channel drawn on the monthly chart. This area may have provided resistance.
The channel drawn about the zigzag of wave (Z) black using Elliott’s technique for a correction is very clearly breached. This is some indication that this wave count may be correct and we may have seen a trend change.
Within the new downwards trend no second wave correction may move beyond the start of the first wave. This wave count is invalidated with any movement above 1,474.51.
If we are in a new downwards trend we may have seen a series of overlapping first and second waves as the last analysis had this movement labeled, or we may be seeing a leading diagonal unfolding in a first wave position as this chart is labeled today.
If price breaks below 1,380.39 then this would be the preferred wave count and we should expect a new downwards trend for months. At that stage I would calculate downwards targets for you. To do so prior to confirmation would be premature.
At this stage at the monthly chart level this second wave count is about even in probability with the first. This wave count has a primary wave B within a flat correction which is just over 138% the length of primary wave A, reducing the probability. Within primary wave B the structure is a rare triple zigzag further reducing the probability to more even with the first wave count which also has a very rare structure.
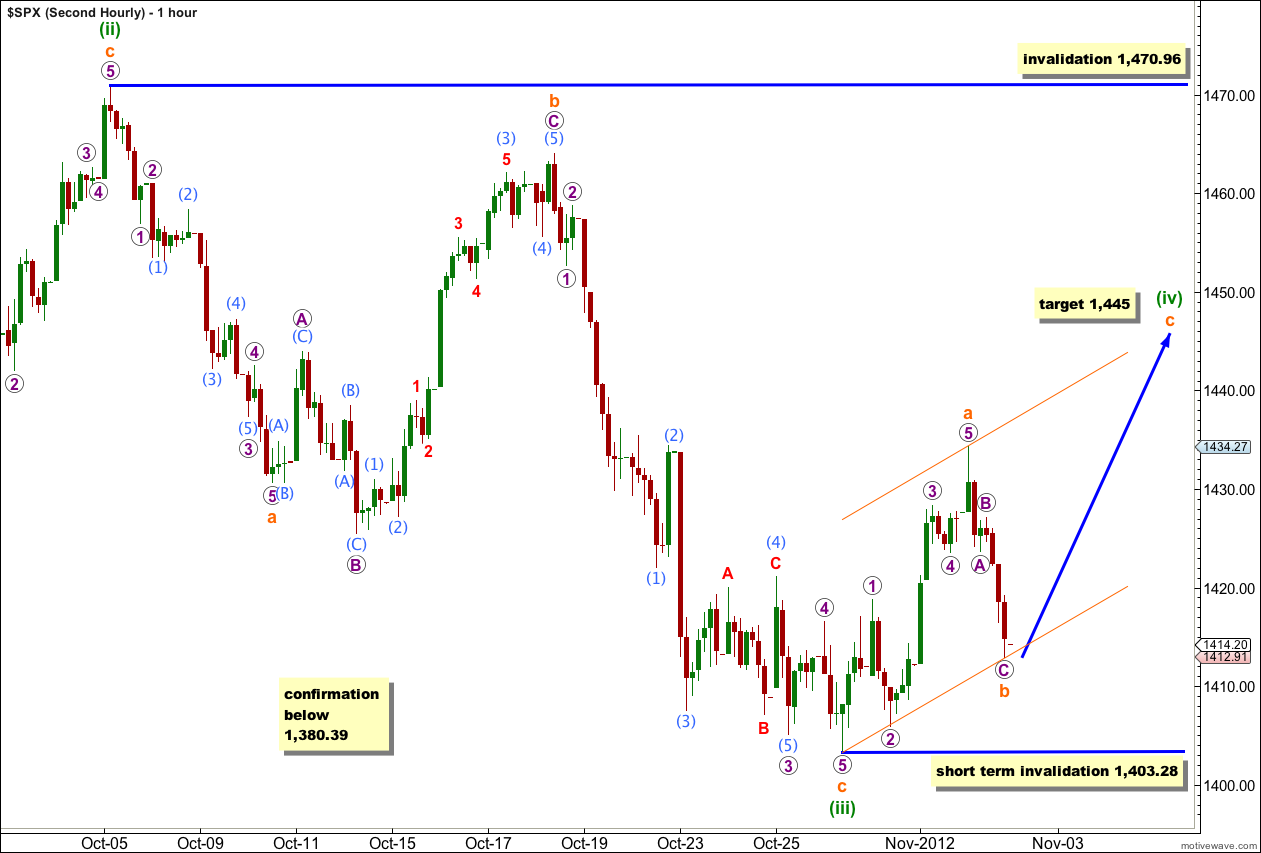
This hourly wave count considers the other structural possibility for a first wave, a leading diagonal.
Within a leading diagonal subwaves 2 and 4 must be zigzags, subwaves 1, 3 and 5 are commonly zigzags but may also be impulses. If one of these is an impulse it is usually the third wave. In this case wave (iii) green may be a zigzag.
Within a diagonal wave 4 should overlap wave 1 price territory but may not move beyond the end of wave 2. Wave (iv) green may not move beyond the end of wave (ii) green at 1,470.96.
Wave (iv) green must subdivide into a zigzag and so it cannot be over at the high labeled wave a orange. At 1,445 wave c orange would reach equality with wave a orange.
The channel drawn about upwards movement is Elliott’s technique for a correction. Wave c orange is likely to end about the upper edge of this channel or to overshoot the channel.
Within wave (iv) green zigzag wave b orange may not move beyond the start of wave a orange. This wave count is invalidated with movement below 1,403.28 in the short term.
When wave (iv) green is complete then wave (v) green must make a new low below the end of wave (iii) green at 1,403.28 because a fifth wave within a leading diagonal may not be truncated.