
Last week’s analysis expected the Dow to move higher and for price to not move below 13,039.86. Price did move higher as expected and has not breached the invalidation point.
At this stage we still have the same two wave counts which differ at the monthly chart level. Members may review monthly charts here.
Click on the charts below to enlarge.
First Wave Count.
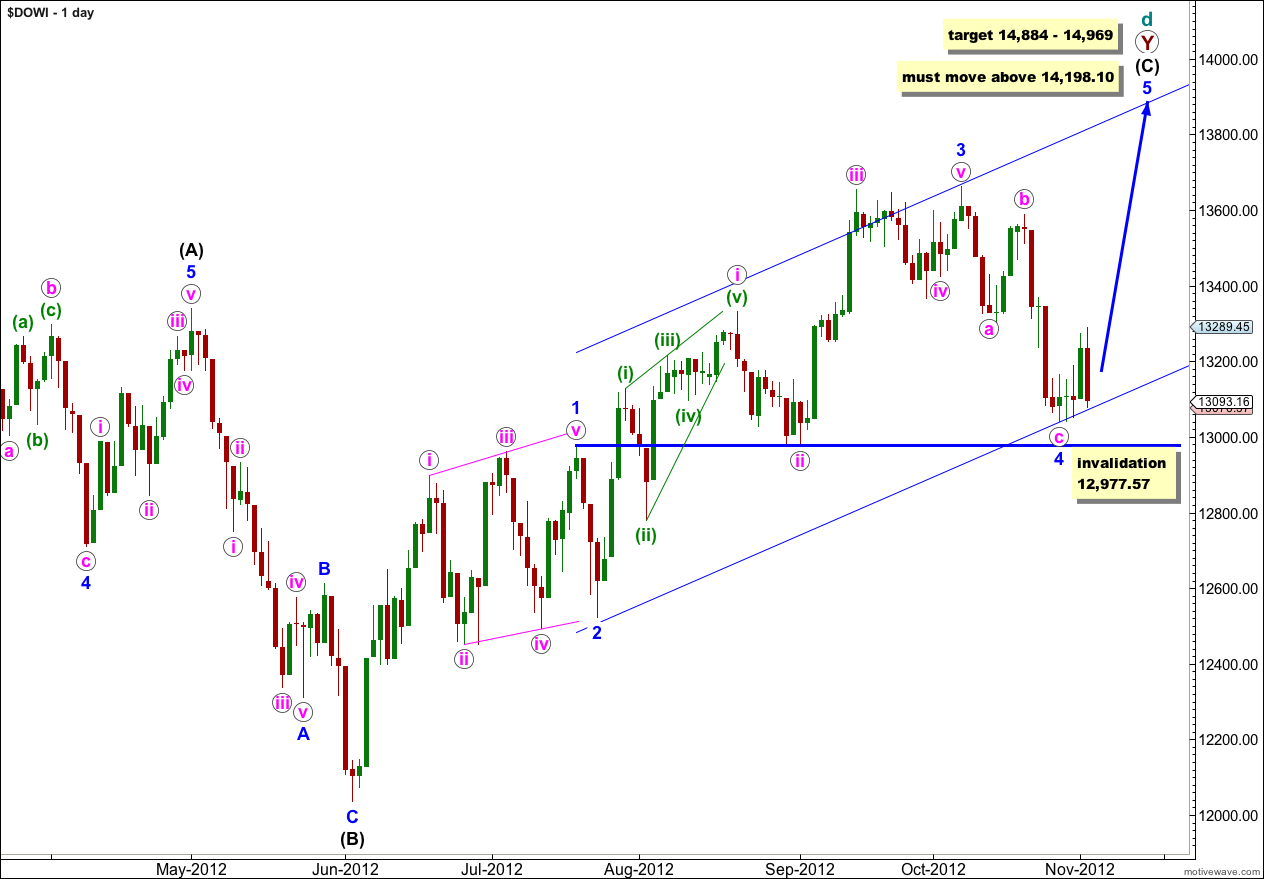
This first wave count looks at the possibility that the Dow is in a very large expanding triangle unfolding at super cycle degree. However, expanding triangles are the rarest of all Elliott wave structures. Because we should always assume that the trend remains the same until proven otherwise (the trend is your friend) I am seriously considering this wave count. The second wave count expects a large trend change at primary degree, which is unconfirmed.
The daily chart shows the subdivisions of wave (C) black which must subdivide into a five wave structure. It is subdividing as an impulse.
Within wave (C) black wave 3 blue is complete.
When wave 4 blue is confirmed as complete then the target upwards may be calculated at blue degree also. At 14,969 wave (C) black would reach equality in length with wave (A) black. At 14,884 wave 5 blue would reach 1.618 the length of wave 1 blue.
Wave 2 blue was a relatively shallow zigzag at only 48% the length of wave 1 blue. Wave 4 blue is exhibiting some alternation in that it is a relatively deep correction at 55% of wave 3 blue. There is no alternation in structure although they do look very different on the daily chart.
Wave 4 blue may not move into wave 1 blue price territory. This wave count is invalidated with movement below 12,977.57.
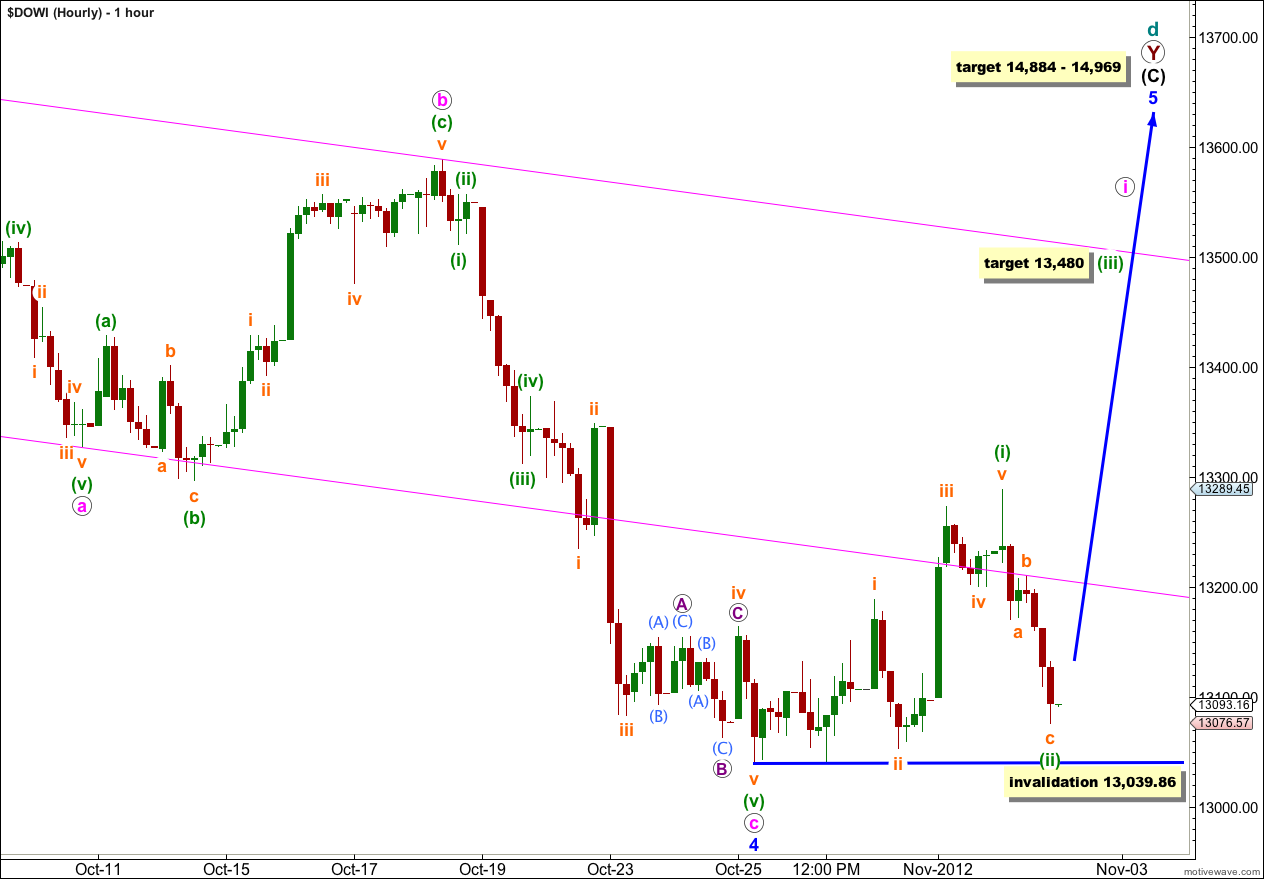
Movement for last week subdivides best as a five upwards labeled wave (i) green, followed by a three downwards labeled wave (ii) green. This is what was expected for this wave count after last week’s analysis.
Ratios within wave (i) green are: wave iii orange is 20.59 points short of 1.618 the length of wave i orange, and wave v orange is just 3.69 points short of 0.618 the length of wave i orange.
Within wave (ii) green wave c orange may not be quite complete. Price may begin Monday’s session with a very little downwards movement before turning higher for a third wave.
About 13,480 wave (iii) green would reach 1.618 the length of wave (i) green.
Wave (ii) green may not move beyond the start of wave (i) green. This wave count is invalidated with movement below 13,039.86.
Second Wave Count.
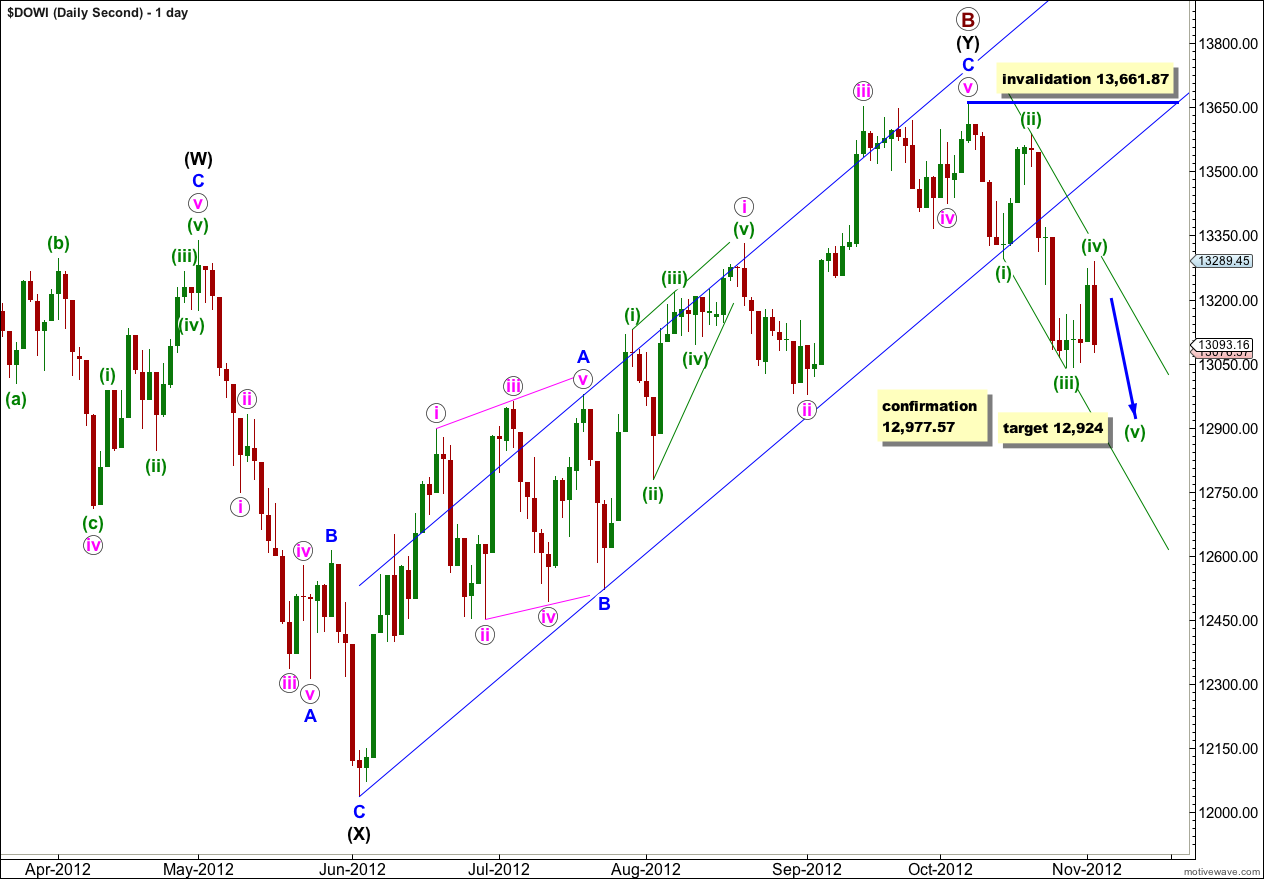
At the monthly chart level this wave count has a very slightly higher probability than the first wave count. This wave count sees a more common structure of a double flat unfolding at super cycle degree, and within the second flat primary waves A and B are complete. This wave count is reduced in probability because primary wave B is longer than 138% the length of primary wave A.
However, because this second wave count expects there has been a recent trend change at primary degree it should be approached with caution. We need the trend change confirmed before we may have confidence in it.
If we have seen a recent trend change then there is a very clear trend channel breach on the daily chart.
So far we may be seeing an impulse unfold downwards with waves (i) through to (iv) green likely to be complete. Wave (v) green would reach equality in length with wave (i) green at 12,924. There is no Fibonacci ratio between waves (i) and (iii) green so it is more likely we shall see a Fibonacci ratio exhibited between wave (v) green and either of (i) or (iii).
If wave (iv) green moves any higher it may not move into wave (i) green price territory. This wave count is invalidated with movement above 13,296.43.
If price moves above 13,296.43 then there is another structural possibility. We may be seeing a leading diagonal unfolding in a first wave position. Upwards movement would be wave (ii) green of a diagonal and the invalidation point would be at 13,661.87.
When wave (v) green is complete then we should expect a second wave correction. This second wave correction may not move beyond the start of the first wave. This wave count is invalidated with movement above 13,661.87.
If there is an impulse unfolding to the downside then we may use Elliott’s first channeling technique to draw a channel about it. So far wave (iv) green is contained within the channel. If it moves further sideways or higher it may find resistance about the upper edge of the channel. Wave (v) green is likely to end mid way within the channel or about the lower edge.