
Yesterday’s analysis had two wave counts which diverged. Price has risen giving a little more clarity, but both wave counts remain valid.
Price is now extremely close to the invalidation point of the second hourly wave count. If this price point is passed tomorrow we may have a little more confidence in the first wave count.
The first and second wave counts still have about an even probability at the monthly chart level. Members may review monthly charts here.
Click on the charts below to enlarge.
First Wave Count.
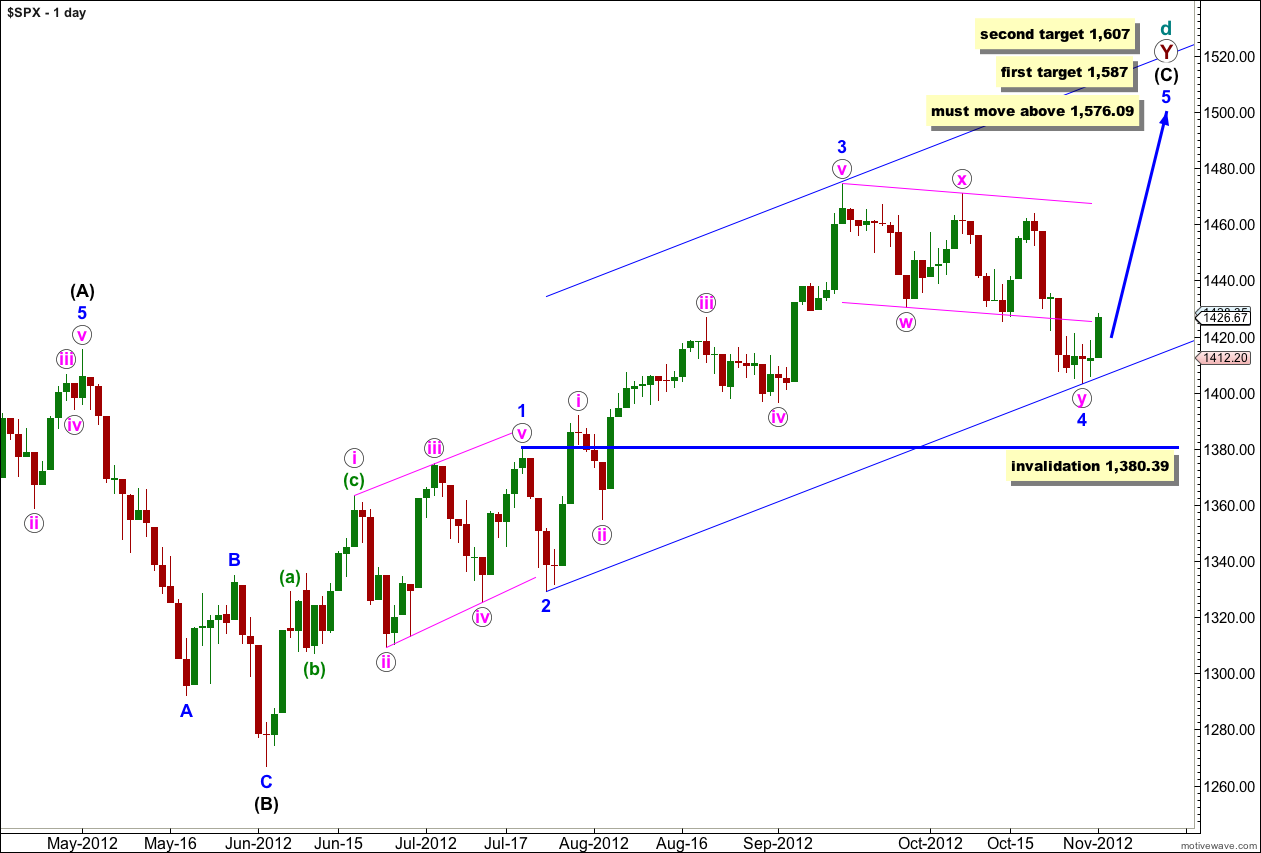
At super cycle degree this wave count sees a very rare expanding triangle unfolding, and cycle wave d upwards within the triangle is a double zigzag which must move beyond the end of cycle wave b.
Within the second zigzag of the double, primary wave Y, wave (C) black must unfold as a five wave structure.
Waves 1 through to 3 blue are complete. Wave 2 blue unfolded as a brief zigzag, and wave 4 blue looks like a double zigzag exhibiting alternation.
Further downwards movement for wave 4 blue may not move into wave 1 blue price territory. This wave count is invalidated with movement below 1,380.39.
At 1,587 wave 5 blue would reach 1.618 the length of wave 1 blue. If price passed through this first target we shall use the second.
At 1,607 wave (C) black would reach equality in length with wave (A) black.
Elliott’s second channeling technique may be used about this impulse of wave (C) black. The first trend line is drawn from the lows of 2 to 4 blue, then a parallel copy is placed upon the high of wave 3 blue. Wave 5 blue should end either mid way within the channel or about the upper edge.
If this wave count is invalidated with downwards movement below 1,380.39 then the second daily wave count would be correct. At that stage it would be difficult to see how a large expanding triangle could be unfolding. Movement below 1,266.74 would invalidate the expanding triangle scenario at the monthly chart level and at intermediate degree (please see monthly charts here for an explanation of the wave count at higher degrees).
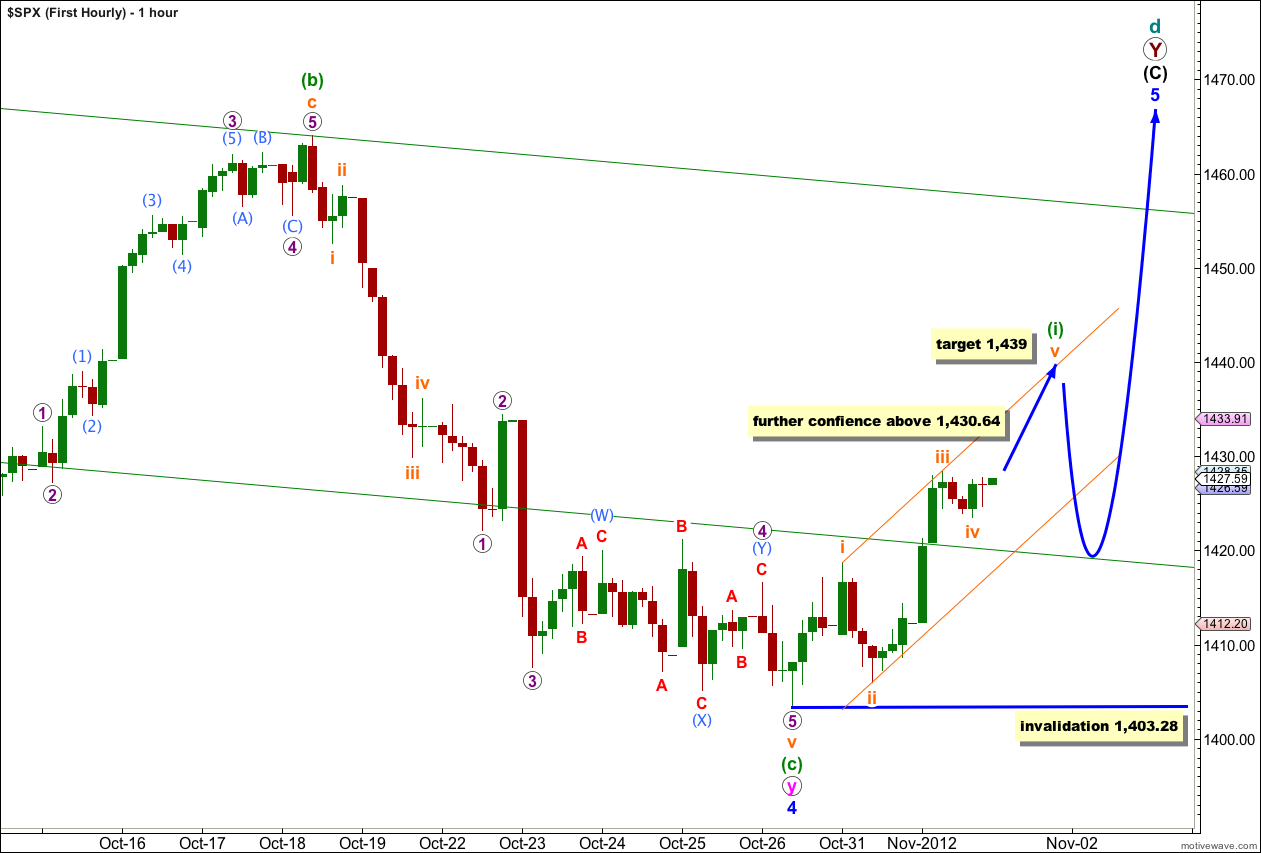
This first wave count so far has a typical look and all the subdivisions fit correctly.
Wave ii orange did not move lower, and may be seen as a zigzag on the 5 minute chart.
Wave iii orange has no Fibonacci ratio to wave i orange so it is more likely we shall see a Fibonacci ratio between wave v orange and either of i or iii. At 1,439 wave v orange would reach equality in length with wave i orange.
When wave v orange may be complete we should expect a second wave correction. Wave (ii) green to follow wave (i) green may not move beyond the start of wave (i) green. This wave count is invalidated with movement below 1,403.28.
When wave (i) green may be considered complete draw a Fibonacci retracement along its length. Expect wave (ii) green to be likely to reach down to 0.618 the length of wave (i) green.
We may draw a channel about this upwards movement using Elliott’s first technique. Draw the first trend line from the highs of waves i to iii orange, then place a parallel copy upon the low of wave ii orange. Wave v orange may end either mid way or about the upper edge of the channel. When the channel is breached by subsequent downwards movement we shall have confirmation that wave (i) green is over and wave (ii) green is underway.
Second Wave Count.
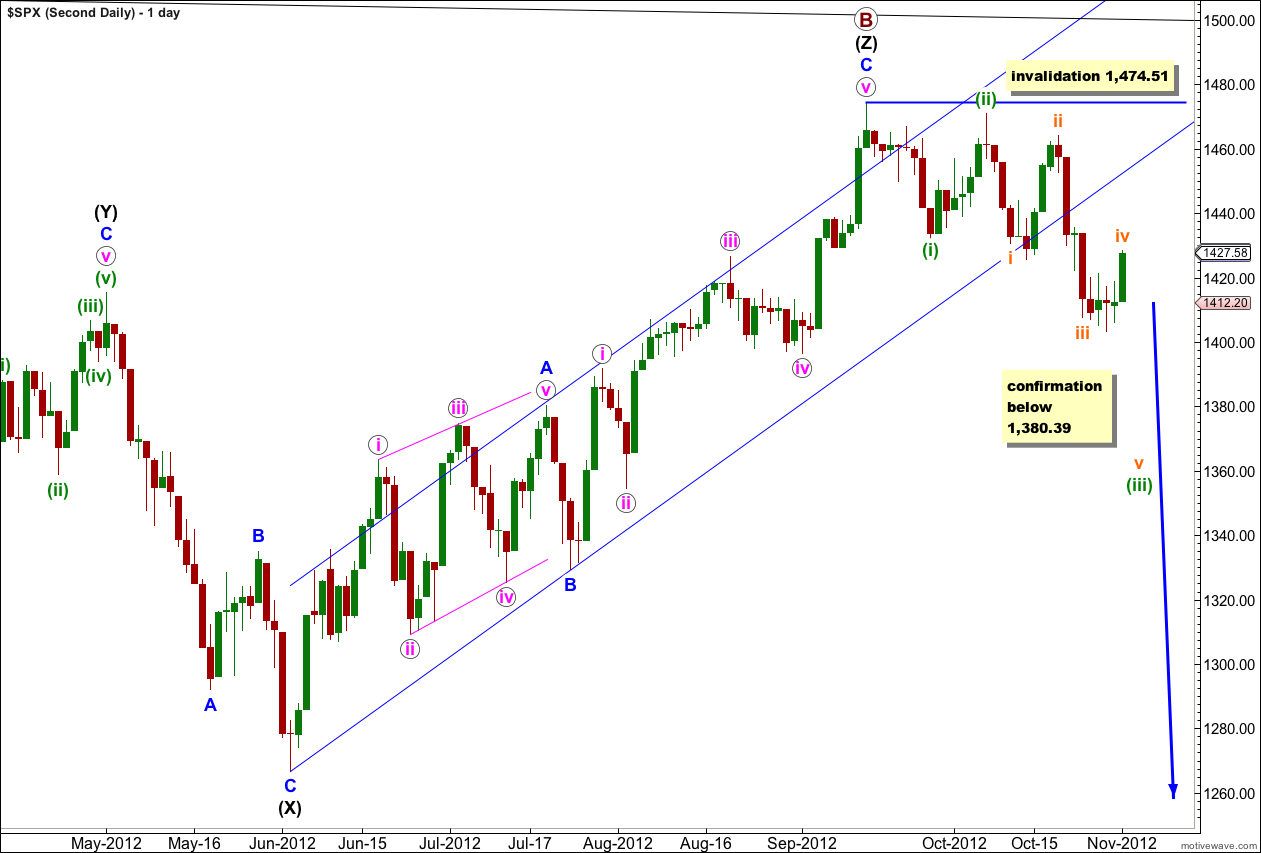
It remains possible that we have recently seen a major trend change in the S&P 500 and the DJIA. We should not place any confidence in this wave count prior to confirmation of a trend change with movement below 1,380.39.
We should always assume that the trend remains the same, until proven otherwise. At this stage we have a little indication of a trend change with a clear channel breach, but we will not have price confirmation until we see movement below 1,380.39 invalidating the first daily wave count.
The upper black line is the upper edge of a parallel channel drawn on the monthly chart. This area may have provided resistance.
The channel drawn about the zigzag of wave (Z) black using Elliott’s technique for a correction is very clearly breached. This is some indication that this wave count may be correct and we may have seen a trend change.
Within the new downwards trend no second wave correction may move beyond the start of the first wave. This wave count is invalidated with any movement above 1,474.51.
If we are in a new downwards trend we may have seen a series of overlapping first and second waves.
If price breaks below 1,380.39 then this would be the preferred wave count and we should expect a new downwards trend for months. At that stage I would calculate downwards targets for you. To do so prior to confirmation would be premature.
At this stage at the monthly chart level this second wave count is about even in probability with the first. This wave count has a primary wave B within a flat correction which is just over 138% the length of primary wave A, reducing the probability. Within primary wave B the structure is a rare triple zigzag further reducing the probability to more even with the first wave count which also has a very rare structure.
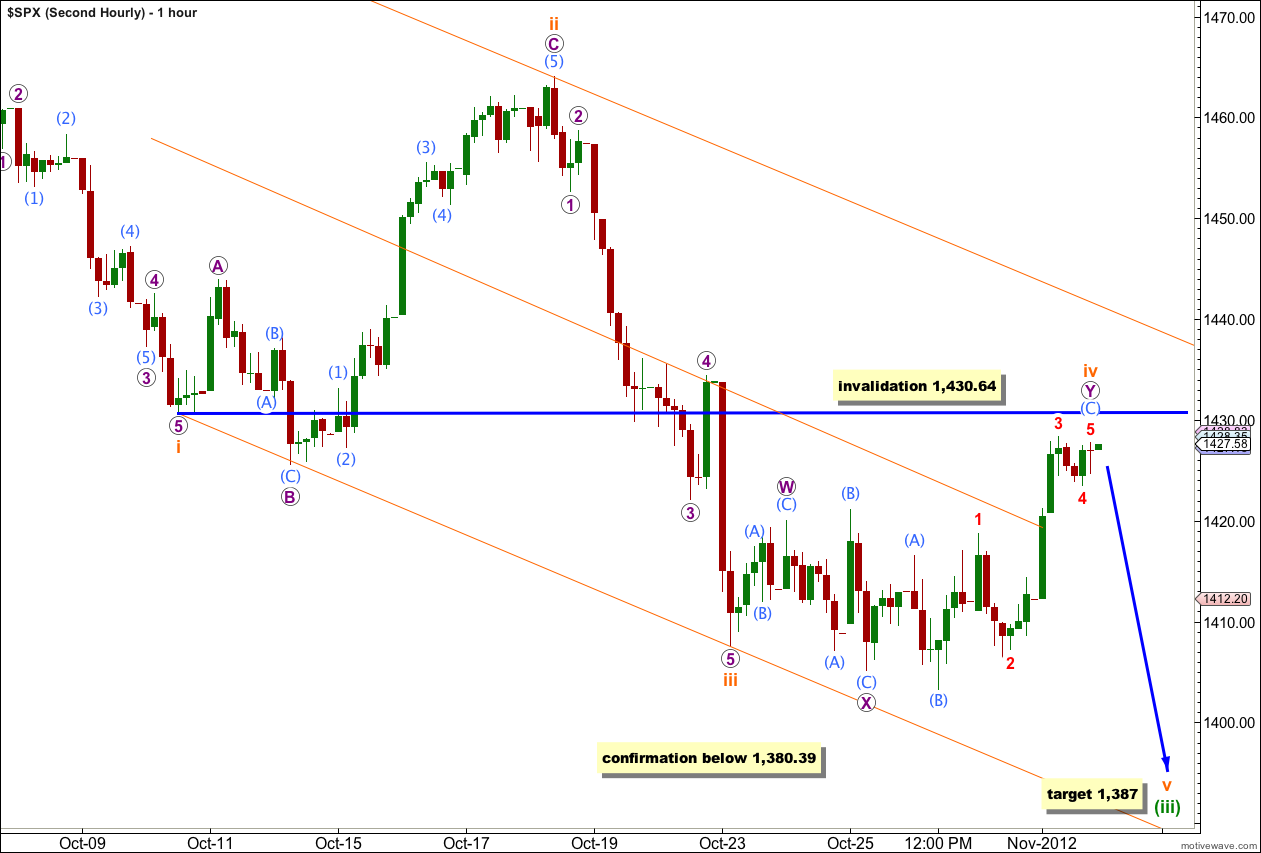
At this stage this hourly wave count remains valid. Wave iv orange has moved price higher but remains below the price territory of wave i orange.
If wave iv orange has ended here then at 1,387 wave v orange would reach equality with wave i orange. Because there is no Fibonacci ratio between waves i and iii orange it would be more likely for wave v orange to exhibit a ratio to either of i or iii.
Wave ii orange was a relatively deep expanded flat correction. Wave iv orange is now a deep double combination correction. They exhibit alternation in structure but not depth.
Wave iv orange having continued higher does not now achieve the purpose of a double combination which is to move price sideways. This reduces the probability that this second hourly wave count is correct.
Wave iv orange may not move into the price territory of wave i orange. This hourly wave count is invalidated with movement above 1,430.64.
If price moves above 1,430.64 tomorrow then I would look at the possibility that we are seeing a leading diagonal unfolding in a first wave position. The invalidation point for that scenario would be at 1,470.96.