
Last analysis expected downwards movement in a low degree third wave which is exactly what we saw for Friday’s session. The target has not been met, but this movement was not expected to be over at the end of the week. The target can now be calculated at two wave degrees and so has a higher probability.
I have still the same two daily wave counts which differ at cycle degree and the monthly chart level. Members may review monthly charts here.
Click on the charts below to enlarge.
First Daily Wave Count.
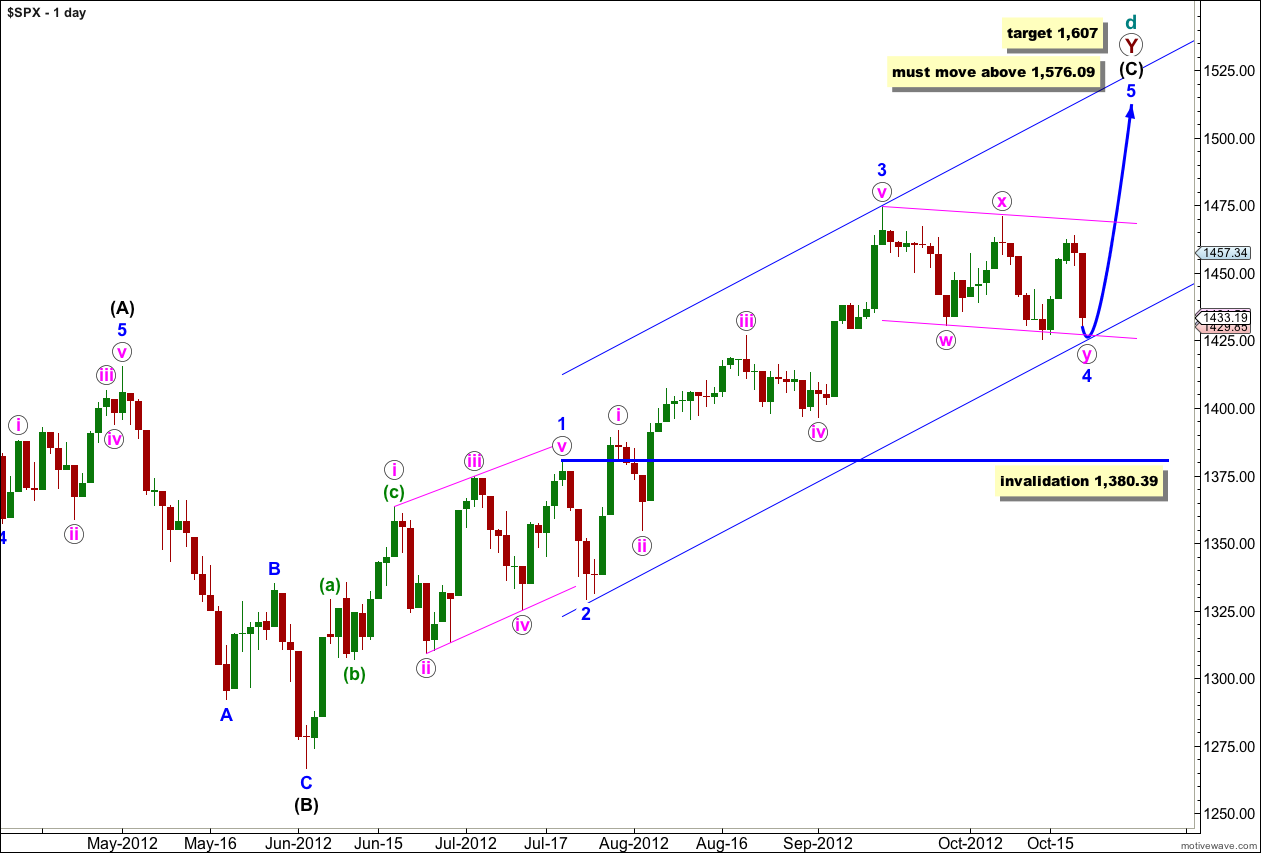
At super cycle degree this wave count sees a very rare expanding triangle unfolding, and cycle wave d upwards within the triangle is a double zigzag which must move beyond the end of cycle wave b.
Within the second zigzag of the double, primary wave Y, wave (C) black must unfold as a five wave structure.
Waves 1 through to 3 blue are complete. Wave 2 blue unfolded as a brief zigzag, and wave 4 blue looks like a double zigzag exhibiting alternation.
Further downwards movement for wave 4 blue may not move into wave 1 blue price territory. This wave count is invalidated with movement below 1,380.39.
At 1,607 wave (C) black would reach equality in length with wave (A) black.
When Elliott’s first channeling technique is used about this impulse it does not work. The channel will have to be drawn correctly when wave 4 blue is complete.
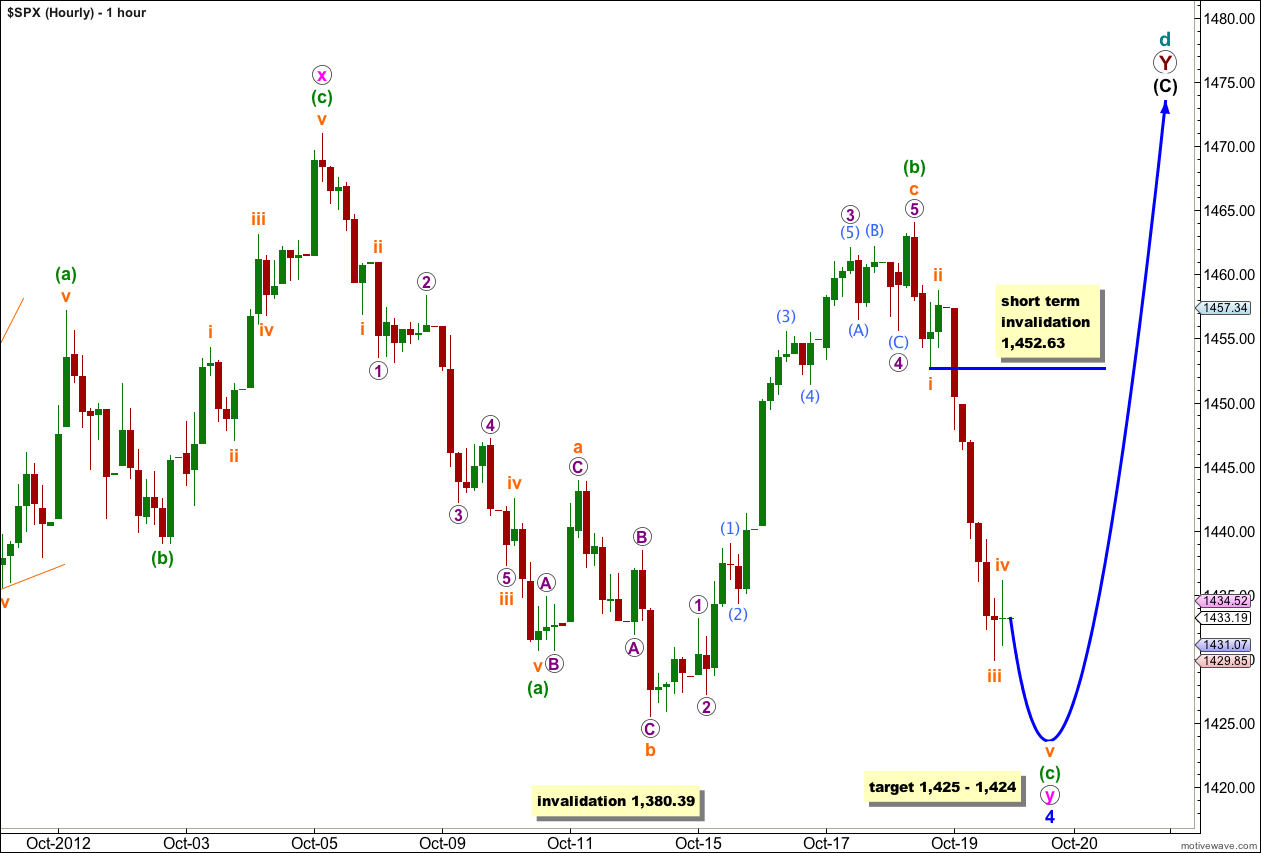
Downwards movement for Friday is a convincing third wave. Wave iii orange is just 0.93 points short of 2.618 the length of wave i orange. On the 5 minute chart wave ii orange looks like a zigzag and is a 54% correction of wave i orange, and wave iv orange looks like a flat correction and is a 21% correction of wave iii orange exhibiting nice alternation.
If wave iv orange moves higher then it may not move into wave i orange price territory. This wave count is invalidated in the short term with movement above 1,452.63 (prior to wave v orange moving price lower).
Once wave v orange is complete then subsequent movement above 1,452.63 would provide strong confirmation that wave 4 blue in its entirety is complete as at that stage upwards movement could not be just a fourth wave correction and so wave (c) green would have to be over.
At 1,425 wave v orange would reach equality in length with wave i orange. At 1,424 wave (c) green would reach equality in length with wave (a) green.
One more downwards wave should end this corrective structure for wave 4 blue.
Wave 4 blue may not move into wave 1 blue price territory. This wave count is invalidated with movement below 1,380.39.
Although the prior alternate hourly wave count remains valid it looks more unlikely after Friday’s movement. The probability is low enough that I do not wish to publish it again at this stage.
Second Daily Wave Count.
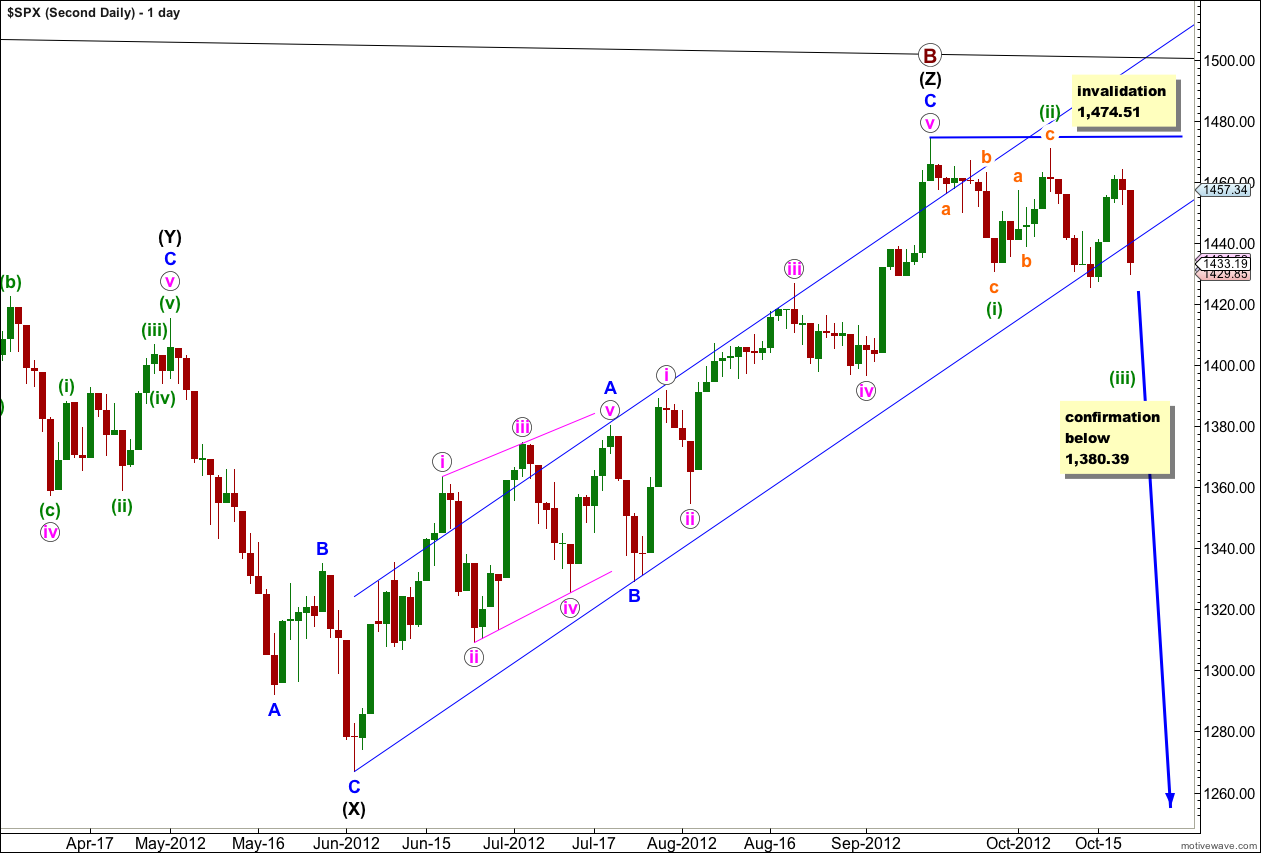
It remains possible that we have recently seen a major trend change in the S&P 500 and the DJIA. We should not place any confidence in this wave count prior to confirmation of a trend change with movement below 1,380.39.
We should always assume that the trend remains the same, until proven otherwise. At this stage we have absolutely no confirmation of a trend change. We will not have confirmation until price moves below 1,380.39 invalidating the first daily wave count.
Within the new downwards trend no second wave correction may move beyond the start of the first wave. This wave count is invalidated with any movement above 1,474.51.
If we are in a new downwards trend then it would be an unfolding leading diagonal. Wave (i) green subdivides into a zigzag, and wave (ii) green may also be seen as a zigzag.