
Yesterday’s analysis expected downwards movement during Thursday’s session which is what we have got. Price has ended lower.
The wave counts are valid and remain the same. The main hourly wave count has a higher probability than the alternate hourly wave count. We should only use the alternate if the main hourly wave count is invalidated.
The first and second daily wave counts differ at monthly chart level and cycle degree. Members may review monthly charts here.
Click on the charts below to enlarge.
First Daily Wave Count.
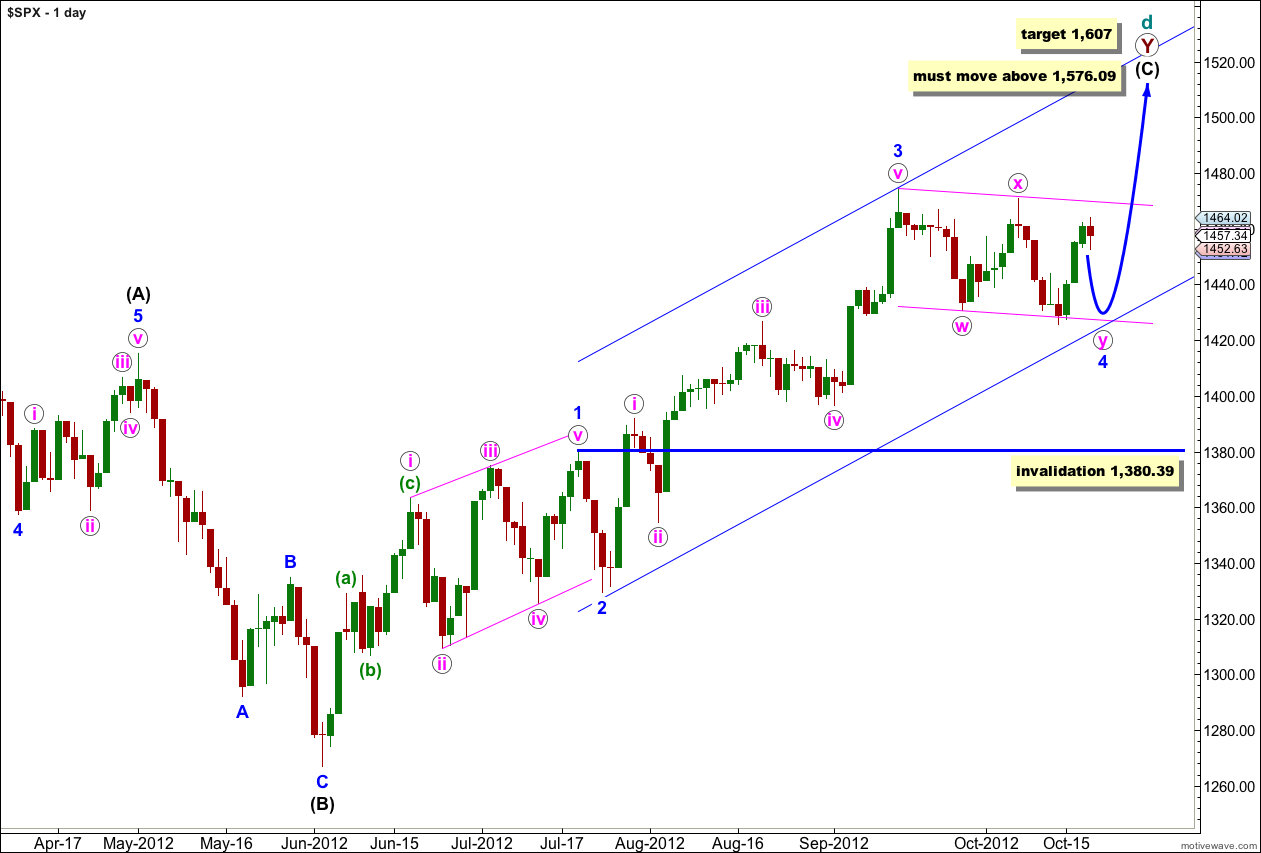
At super cycle degree this wave count sees a very rare expanding triangle unfolding, and cycle wave d upwards within the triangle is a double zigzag which must move beyond the end of cycle wave b.
Within the second zigzag of the double, primary wave Y, wave (C) black must unfold as a five wave structure.
Waves 1 through to 3 blue are complete. Wave 2 blue unfolded as a brief zigzag, and wave 4 blue looks like a double zigzag exhibiting alternation.
Further downwards movement for wave 4 blue may not move into wave 1 blue price territory. This wave count is invalidated with movement below 1,380.39.
At 1,607 wave (C) black would reach equality in length with wave (A) black.
When Elliott’s first channeling technique is used about this impulse it does not work. The channel will have to be drawn correctly when wave 4 blue is complete.
Main Hourly Wave Count.
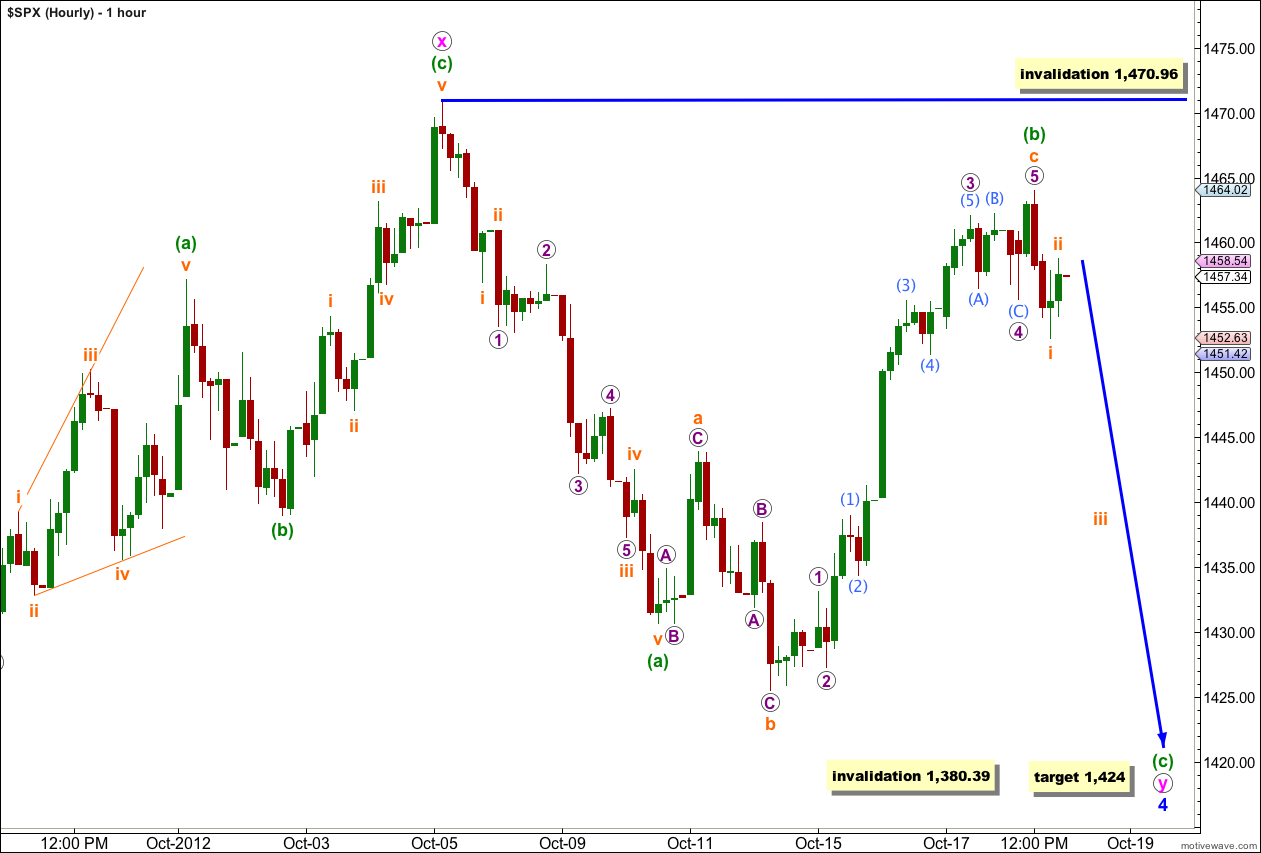
Within the second structure of the double for wave 4 blue, labeled wave y pink, waves (a) and (b) green are now complete. Wave (c) green may have begun at the end of Thursday’s session.
Within wave (b) green wave 5 purple moved a little higher at the start of Thursday’s session after wave 4 purple completed an expanded flat correction.
Ratios within wave c orange ratios are: wave 3 purple is 2.69 points longer than 4.236 the length of wave 1 purple, and wave 5 purple is 0.83 points longer than equality with wave 1 purple.
Ratios within wave 3 purple are: wave (3) aqua has no Fibonacci ratio to wave (1) aqua, and wave (5) aqua has no adequate Fibonacci ratio to either of (1) or (3) aqua.
Within wave (c) green wave i orange may be complete and wave ii orange is likely to move a little higher early during Friday’s session. Wave ii orange may not move beyond the start of wave i orange. If price moves above 1,464.02 then wave (c) green has not begun and wave (b) green is moving a little higher.
Wave (b) green may not move beyond the start of wave (a) green. This wave count is invalidated with movement above 1,470.96.
If this wave count is invalidated with upwards movement then we may use the alternate below.
Alternate Hourly Wave Count.
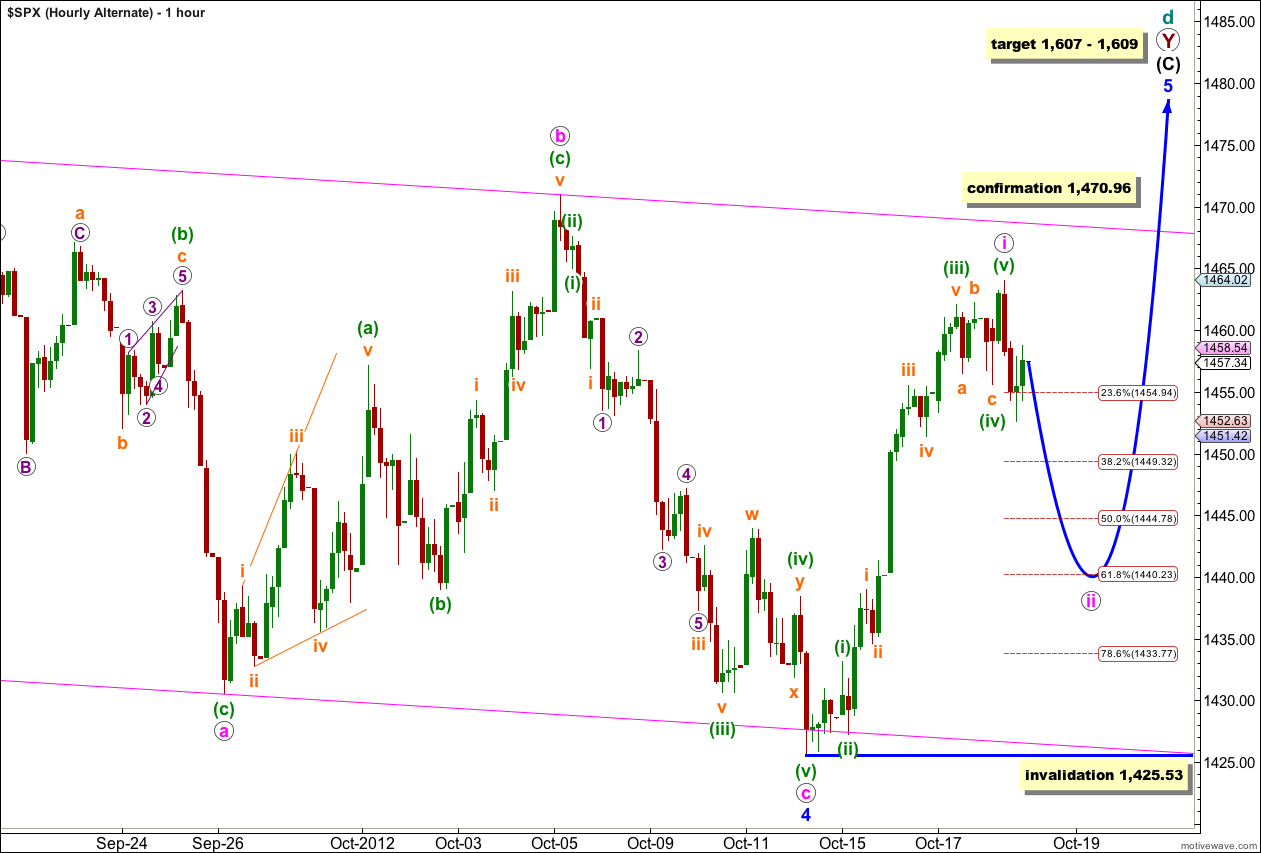
It is possible that wave 4 blue is over, but less likely.
This alternate wave count has a lower probability than the main hourly wave count for three reasons:
1. The structure of wave (iv) green within wave c pink within wave 4 blue: this is a double zigzag but has not achieved the purpose of a double zigzag which is to deepen a correction.
2. Within wave (iv) green of wave c pink of wave 4 blue: on the 5 minute chart wave x orange does not subdivide well as a three, it looks more like a five.
3. Within wave c pink of wave 4 blue waves (ii) and (iv) green are very much out of proportion.
This wave count also expects more downwards movement as very likely. Wave ii pink would be most likely to end about the 0.618 Fibonacci ratio of wave i pink at 1,440.23.
Wave ii pink may not move beyond the start of wave i pink. This wave count is invalidated with movement below 1,425.53.
At 1,609 wave 5 blue would reach 1.618 the length of wave 1 blue. At 1,607 wave (C) black would reach equality in length with wave (A) black.
Second Daily Wave Count.
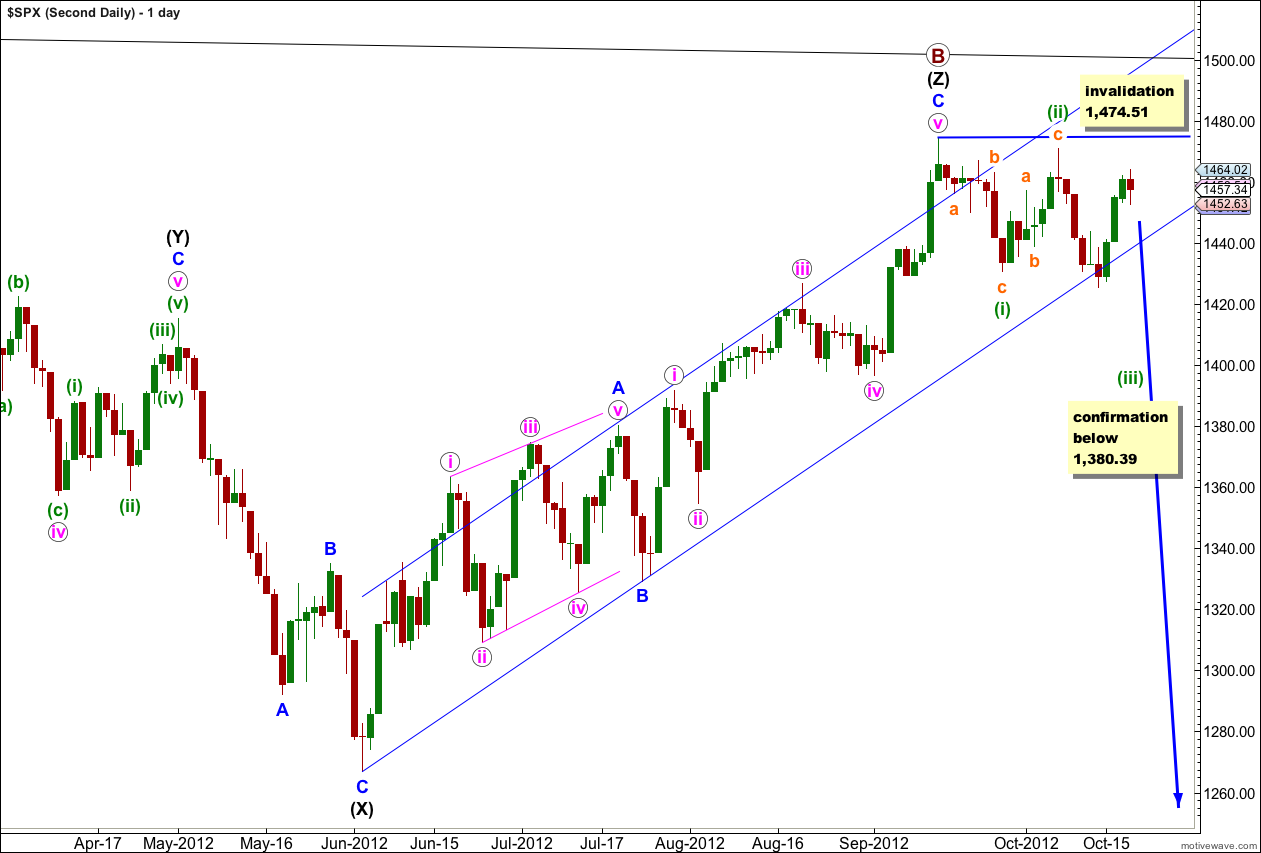
It remains possible that we have recently seen a major trend change in the S&P 500 and the DJIA. We should not place any confidence in this wave count prior to confirmation of a trend change with movement below 1,380.39.
We should always assume that the trend remains the same, until proven otherwise. At this stage we have absolutely no confirmation of a trend change. We will not have confirmation until price moves below 1,380.39 invalidating the first daily wave count.
Within the new downwards trend no second wave correction may move beyond the start of the first wave. This wave count is invalidated with any movement above 1,474.51.
If we are in a new downwards trend then it would be an unfolding leading diagonal. Wave (i) green subdivides into a zigzag, and wave (ii) green may also be seen as a zigzag.