
Last analysis expected downwards movement for Wednesday’s session, but price moved higher. The wave count remains valid.
I have an alternate hourly wave count for you today which has a low probability. It expects the same price direction for tomorrow’s session, but the target is different.
Click on the charts below to enlarge.
First Daily Wave Count.
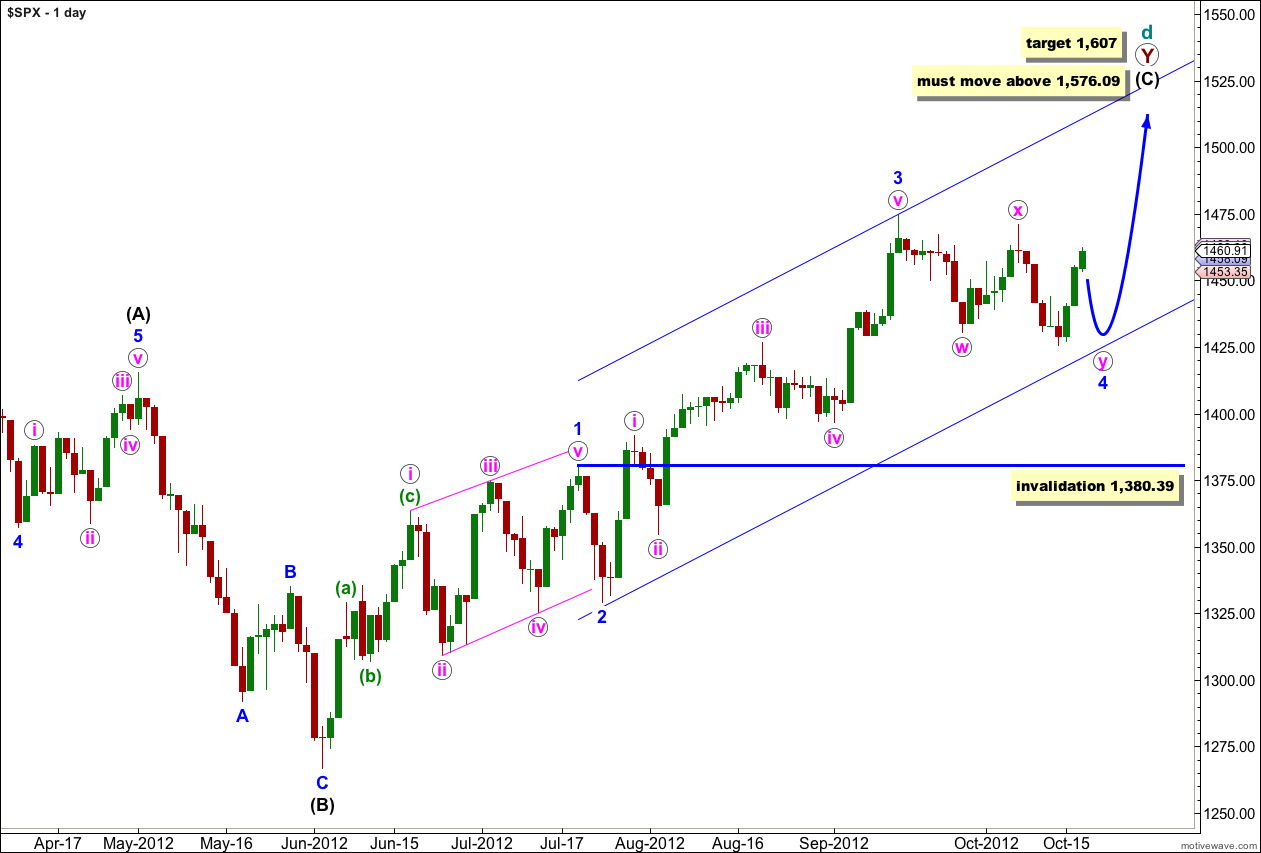
At super cycle degree this wave count sees a very rare expanding triangle unfolding, and cycle wave d upwards within the triangle is a double zigzag which must move beyond the end of cycle wave b.
Within the second zigzag of the double, primary wave Y, wave (C) black must unfold as a five wave structure.
Waves 1 through to 3 blue are complete. Wave 2 blue unfolded as a brief zigzag, and wave 4 blue looks like a double zigzag exhibiting alternation.
Further downwards movement for wave 4 blue may not move into wave 1 blue price territory. This wave count is invalidated with movement below 1,380.39.
When Elliott’s first channeling technique is used about this impulse it does not work. The channel will have to be drawn correctly when wave 4 blue is complete.
Main Hourly Wave Count.
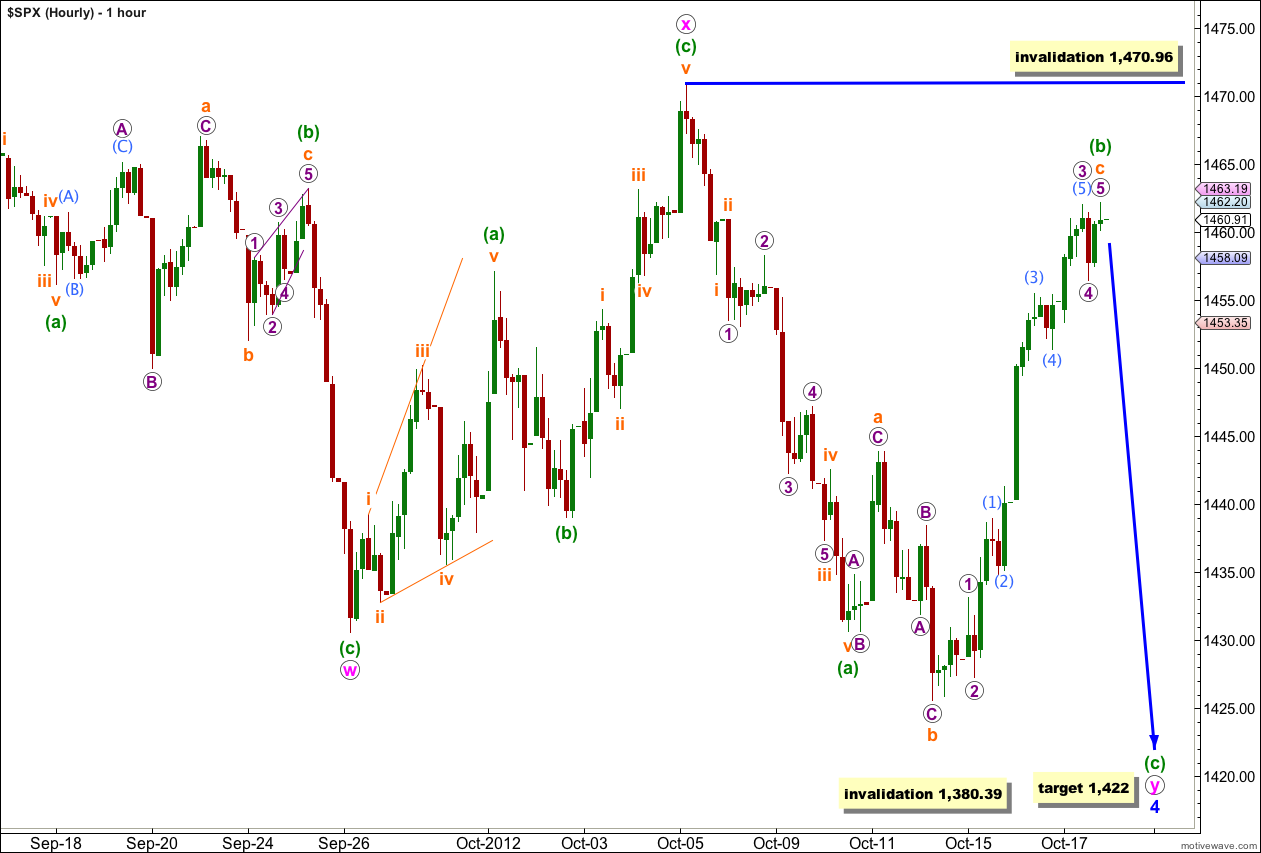
This main hourly wave count follows on directly from yesterday’s hourly wave count. It has a higher probability because subdivisions have a better fit, and because proportions are better.
Wave 4 blue may not be over and may be continuing as a double zigzag. Within the double the final wave (c) green of the second structure, wave y pink, must take price lower.
At 1,422 wave (c) green would reach equality with wave (a) green. Wave (a) green lasted 3 sessions so wave (c) green could reasonably be expected to also last about 3 sessions.
Within wave (b) green wave c orange is now 1.96 points longer than 2.618 the length of wave a orange.
Ratios within wave c orange are: wave 3 purple is 2.67 points longer than 4.236 the length of wave 1 purple, and wave 5 purple has no adequate Fibonacci ratio to either of waves 1 or 3 purple.
Ratios within wave 3 purple extension are: wave (3) aqua is 1.37 points longer than 1.618 the length of wave (1) aqua, and wave (5) aqua has no adequate Fibonacci ratio to either of waves (1) or (3) aqua.
On the 5 minute chart the final upwards wave for 5 purple subdivides nicely into a five wave impulse. However, this may be only wave (1) aqua within wave 5 purple which could extend a little higher. Movement below the end of wave 4 purple at 1,456.49 would add confidence to this wave count and the downwards target.
If wave 5 purple does extend higher then wave (b) green may not move beyond the start of wave (a) green. This wave count is invalidated with movement above 1,470.96. If this wave count is invalidated with upwards movement tomorrow then I shall use the alternate hourly wave count below.
Alternate Hourly Wave Count.
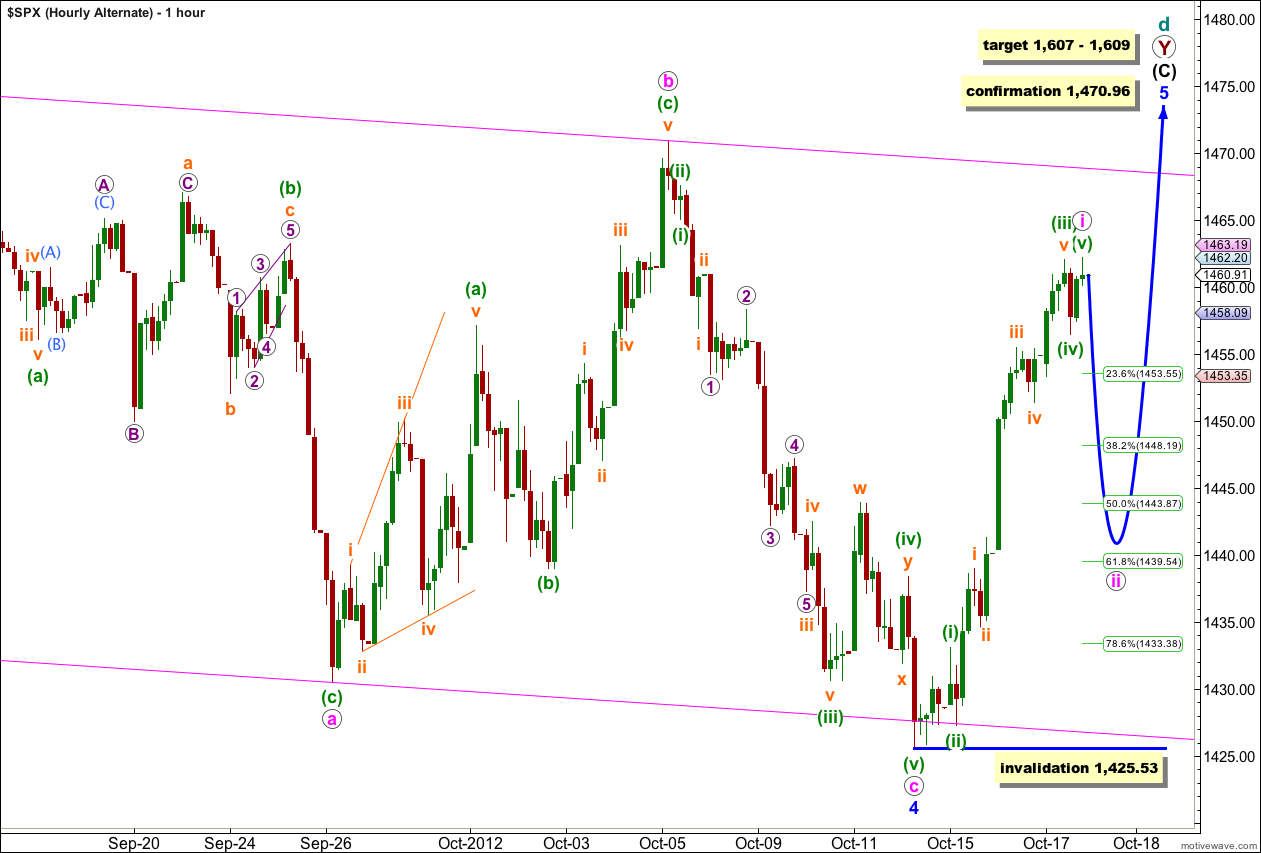
If wave 4 blue was a regular flat correction then it may already be over. However, this wave count has a lower probability because the size of waves (ii) and (iv) green within wave c pink are out of proportion, and wave (iv) green as a double zigzag has not achieved its purpose of deepening a correction. In fact, it was quite the opposite. Also, the structure on the 5 minute chart for the subwave of wave w orange within wave (iv) green does not look easily like a three, it looks much better as a five.
However, movement above 1,470.96 would indicate that the correction for wave 4 blue is most likely over and wave 5 blue should be underway.
At 1,609 wave 5 blue would reach 1.618 the length of wave 1 blue. At 1,607 wave (C) black would reach equality in length with wave (A) black.
In the short to mid term this wave count also expects downwards movement, for a second wave correction. Wave ii pink would likely end about the 0.618 Fibonacci ratio of wave i pink about 1,439.54.
Wave ii pink may not move beyond the start of wave i pink. This alternate hourly wave count is invalidated with movement below 1,425.53.
Second Daily Wave Count.

It remains possible that we have recently seen a major trend change in the S&P 500 and the DJIA. We should not place any confidence in this wave count prior to confirmation of a trend change with movement below 1,380.39.
We should always assume that the trend remains the same, until proven otherwise. At this stage we have absolutely no confirmation of a trend change. We will not have confirmation until price moves below 1,380.39 invalidating the first daily wave count.
Within the new downwards trend no second wave correction may move beyond the start of the first wave. This wave count is invalidated with any movement above 1,474.51.
If we are in a new downwards trend then it would be an unfolding leading diagonal. Wave (i) green subdivides into a zigzag, and wave (ii) green may also be seen as a zigzag.