
Last analysis expected upwards movement for the week from the Dow. However, downwards movement invalidated the wave count early in the week.
I have still two daily wave counts which differ at cycle degree. Members may review monthly charts here.
I have one hourly wave count for this week.
Click on the charts below to enlarge.
First Daily Wave Count.
This first wave count looks at the possibility that the Dow is in a very large expanding triangle unfolding at super cycle degree. However, expanding triangles are the rarest of all Elliott wave structures.
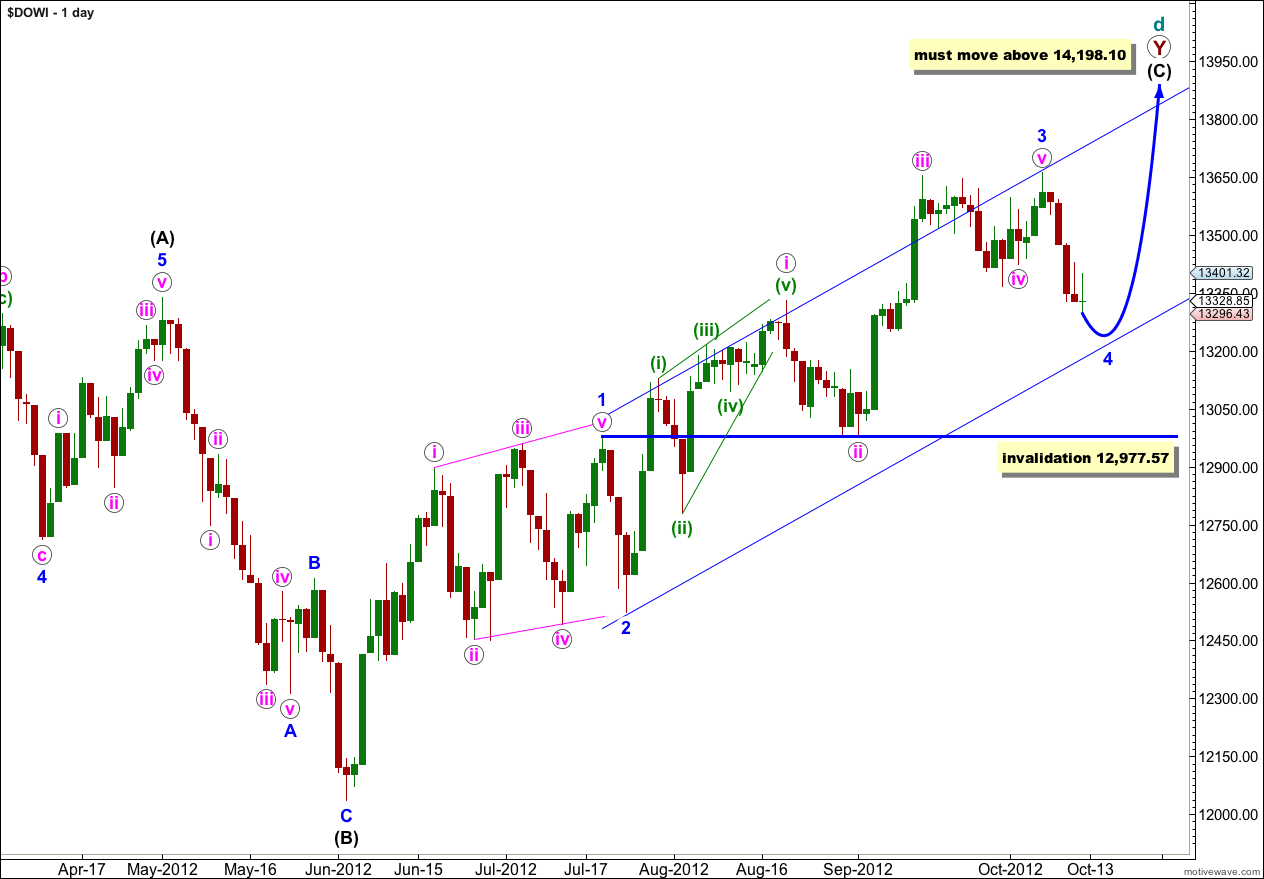
The daily chart shows the subdivisions of wave (C) black which must subdivide into a five wave structure. It is subdividing as an impulse.
Downwards movement may not be a fourth wave within an extension of wave iii pink. It may be a fourth wave two degrees higher, at blue (minor) degree.
Wave 2 blue was a zigzag. I would expect wave 4 blue to exhibit alternation and be a flat, double or triangle.
Within wave (C) black wave 3 blue is complete.
Downwards movement of last week may be wave 4 blue.
When wave 4 blue is complete then the target upwards may be calculated at blue degree also. At 14,969 wave (C) black would reach equality in length with wave (A) black.
Wave 4 blue may not move into wave 1 blue price territory. This wave count is invalidated with movement below 12,977.57.
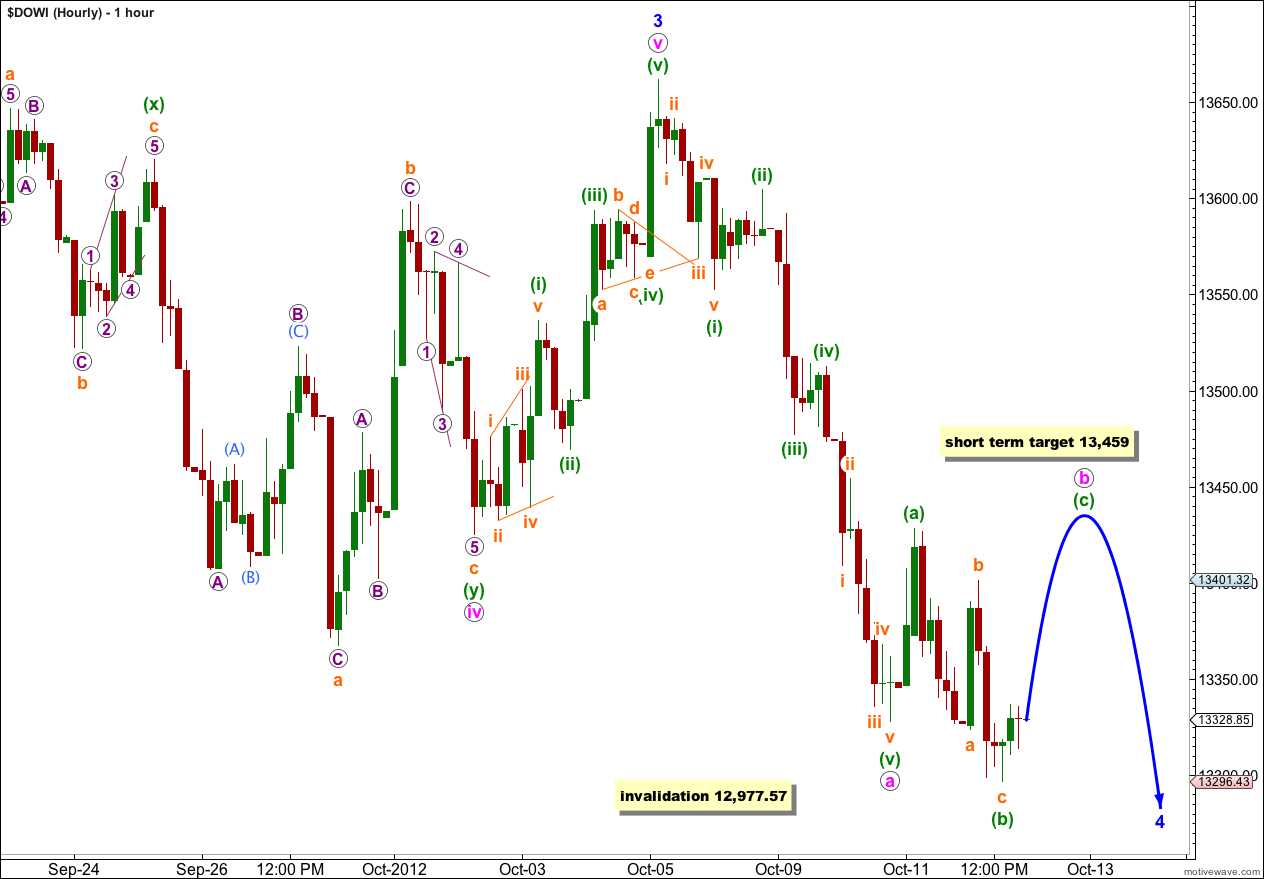
So far downwards movement looks like a five wave impulse followed by a possible unfolding flat correction. This may be a zigzag for wave 4 blue unfolding, or it may be a zigzag as the first structure in a double for wave 4 blue.
At this stage if wave b pink is unfolding as a flat correction then wave (b) green is a 131% correction of wave (a) green. At 13,459 wave (c) green would reach 1.618 the length of wave (a) green.
Thereafter, this wave count expects more downwards movement to a new low below the end of wave a pink at 13,327.77 as highly likely. When we know where wave b pink has ended then we may calculate a target downwards for wave c pink.
Wave 4 blue may not move into wave 1 blue price territory. This wave count is invalidated with movement below 12,977.57.
Second Daily Wave Count.
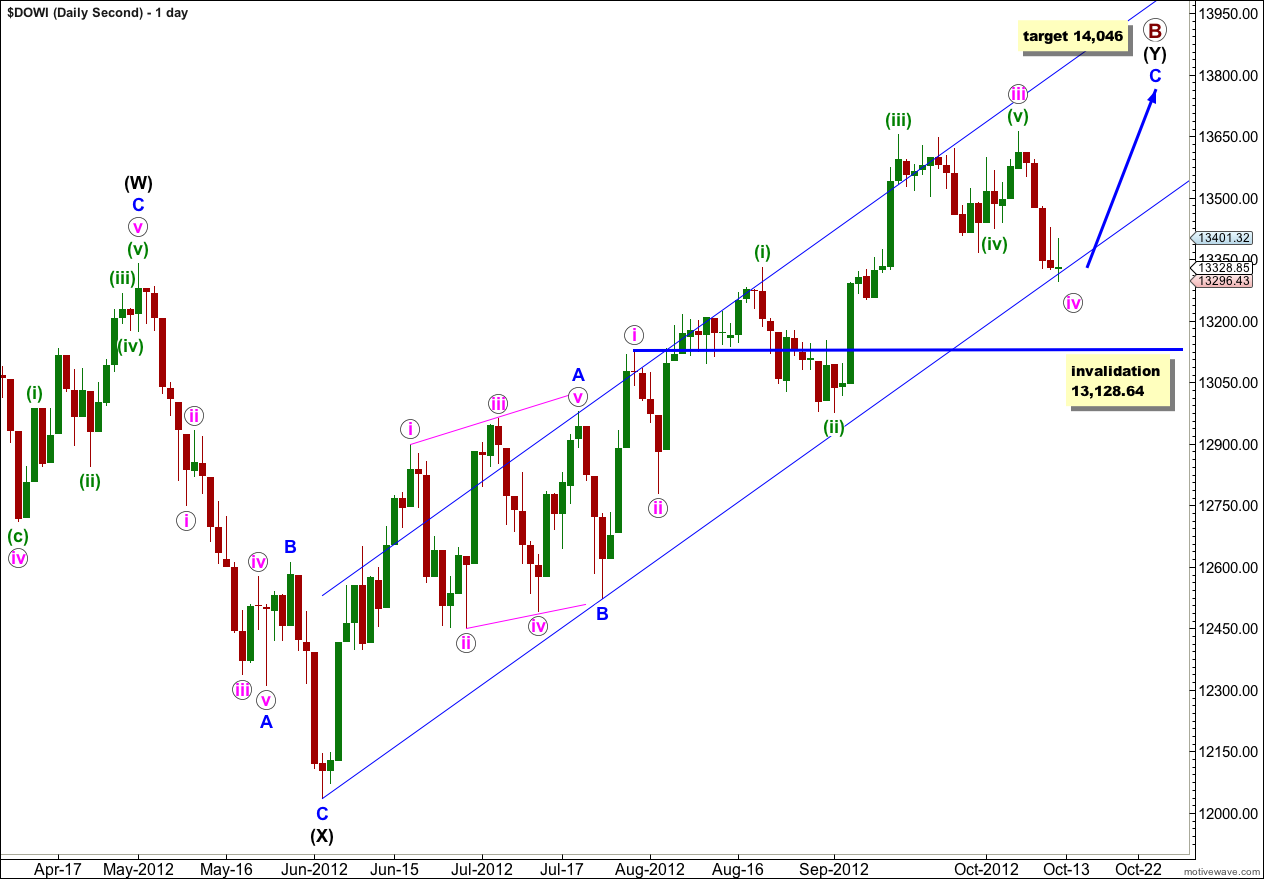
At the monthly chart level this wave count sees a double flat unfolding. Within the second structure of the double, a flat at super cycle degree, cycle wave a is itself unfolding as a flat correction with a three wave structure for primary wave A and a three for primary wave B incomplete.
However, primary wave B is over 138% the length of primary wave A which reduces this wave count in probability, making it more even with the first daily wave count.
Within wave C blue waves i, ii and iii pink may all be complete. This wave count sees downwards movement also as an incomplete fourth wave but one degree lower so the hourly chart will suffice for this wave count also.
Wave C blue has already passed equality in length with wave A blue. The next target is at 14,046 where wave C blue would reach 1.618 the length of wave A blue.
Wave iv pink may not move into wave i pink price territory. This wave count is invalidated with movement below 13,128.64.