
Last analysis expected choppy, overlapping and slightly lower movement for Thursday’s session. Price moved sideways but without making a new low, and remained well under the invalidation point on the hourly chart.
I have still the same two daily wave counts which still differ at the monthly chart level, and one hourly chart. You may review monthly charts here.
Click on the charts below to enlarge.
First Daily Wave Count.
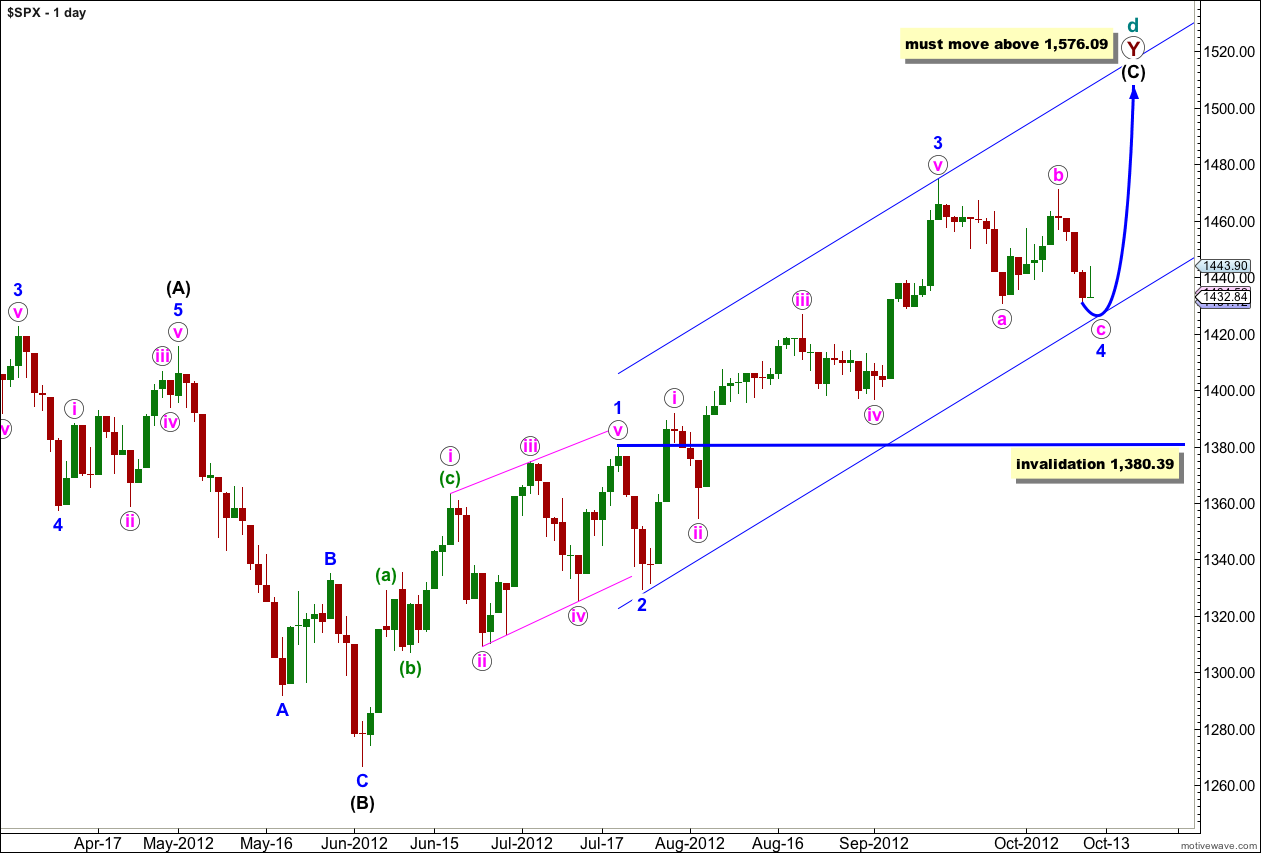
At super cycle degree this wave count sees a very rare expanding triangle unfolding, and cycle wave d upwards within the triangle is a double zigzag which must move beyond the end of cycle wave b.
Within the second zigzag of the double, primary wave Y, wave (C) black must unfold as a five wave structure.
Waves 1 through to 3 blue are complete. Wave 2 blue unfolded as a brief zigzag, wave 4 blue looks like a flat correction exhibiting nice alternation. It is highly likely that wave c pink will move to a new low below the end of wave a pink to avoid a truncation.
Any further downwards movement for wave 4 blue may not move into wave 1 blue price territory. This wave count is invalidated with movement below 1,380.39.
When Elliott’s first channeling technique is used about this impulse it does not work. The channel will have to be drawn correctly when wave 4 blue is complete.
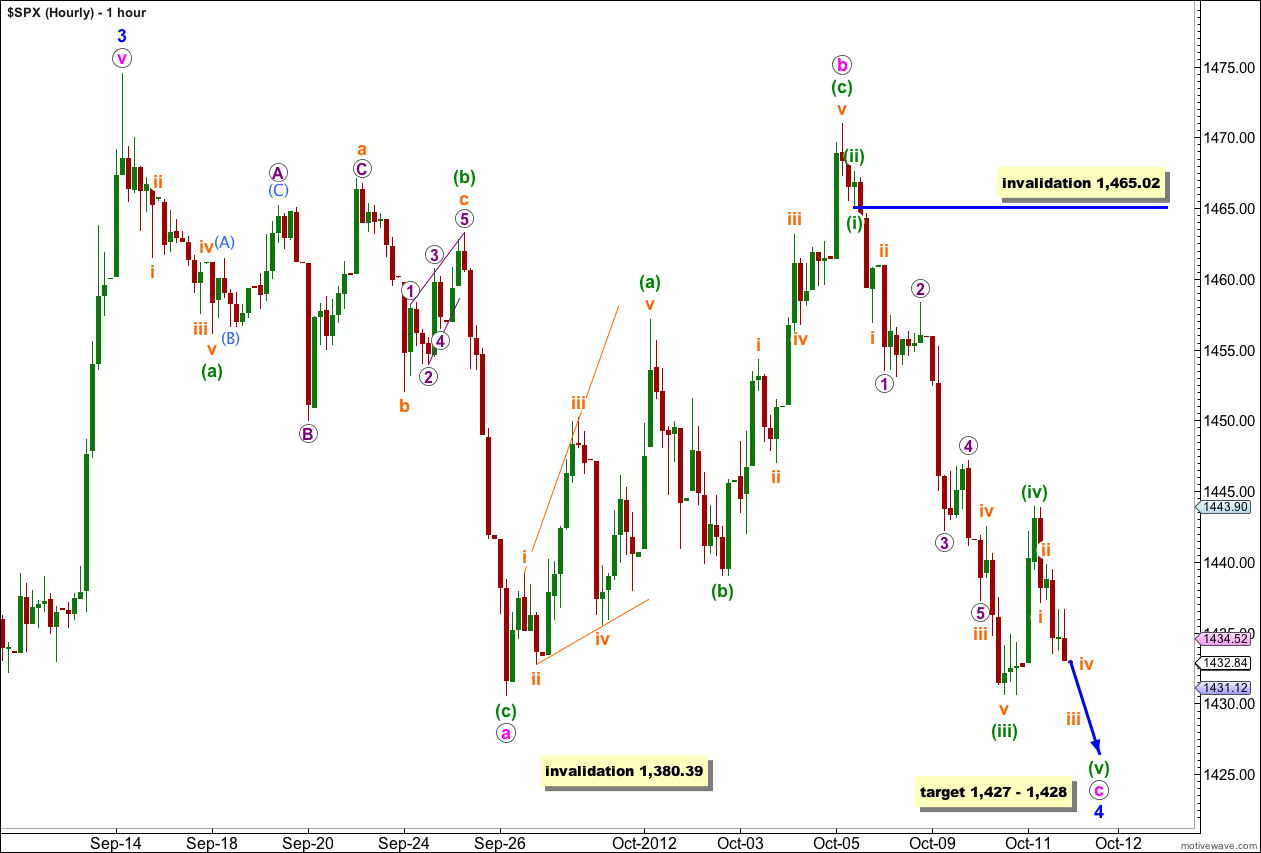
Within wave c pink the structure is still incomplete.
I have adjusted the wave count to see the third wave, wave (iii) green, within wave c pink as extending which is most typical. Upwards movement during Thursday’s session was most likely a fourth wave for (iv) green.
Wave (iii) green has no Fibonacci ratio to wave (i) green. This means it is more likely that wave (v) green will exhibit a Fibonacci ratio to either of waves (i) or (iii) green.
Ratios within wave (iii) green are: wave i orange has no Fibonacci ratio to wave iii orange, and wave v orange is 1.18 points longer than equality with wave i orange.
Ratios within wave iii orange are: wave 3 purple has no Fibonacci ratio to wave 1 purple, and wave 5 purple is just 0.05 points short of 0.618 the length of wave 3 purple.
Wave (v) green would reach 2.618 the length of wave (i) green at 1,428. At 1,427 wave c pink would reach equality in length with wave a pink. This one point target zone has a good probability.
Second Daily Wave Count.
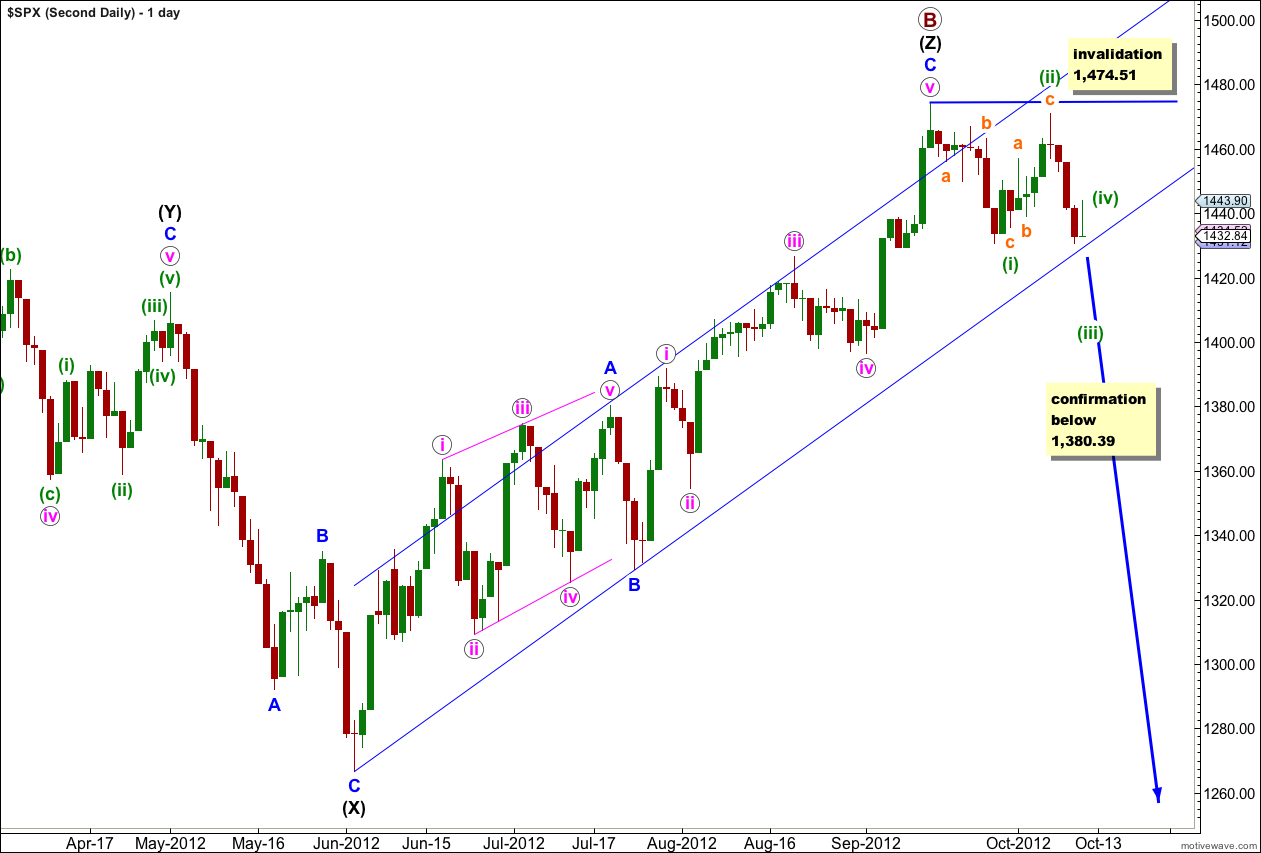
It remains possible but unlikely that we have recently seen a major trend change in the S&P 500 and the DJIA.
We should always assume that the trend remains the same, until proven otherwise. At this stage we have absolutely no confirmation of a trend change. We will not have confirmation until price moves below 1,380.39 invalidating the main wave count.
I publish this chart so that we aware of this possibility. We should not rely upon it without confirmation.
Within the new downwards trend no second wave correction may move beyond the start of the first wave. This wave count is invalidated with any movement above 1,474.51.
I can see a possibility of this wave count working for the Dow, but it does not have a very good look.
If we are in a new downwards trend then it would be an unfolding leading diagonal. Wave (i) green subdivides into a zigzag, and wave (ii) green may also be seen as a zigzag. Wave (iii) green must make a new low below the end of wave (i) green.