
Yesterday’s analysis expected upwards movement for Wednesday’s session which is what happened. However, momentum still remains slower than expected.
I have the same daily charts for you. Today I have a new hourly alternate which looks at recent upwards movement differently and explains the lack of momentum.
The two daily wave counts differ at monthly chart level and cycle degree. You may review monthly charts here.
Click on the charts below to enlarge.
First Daily Wave Count.
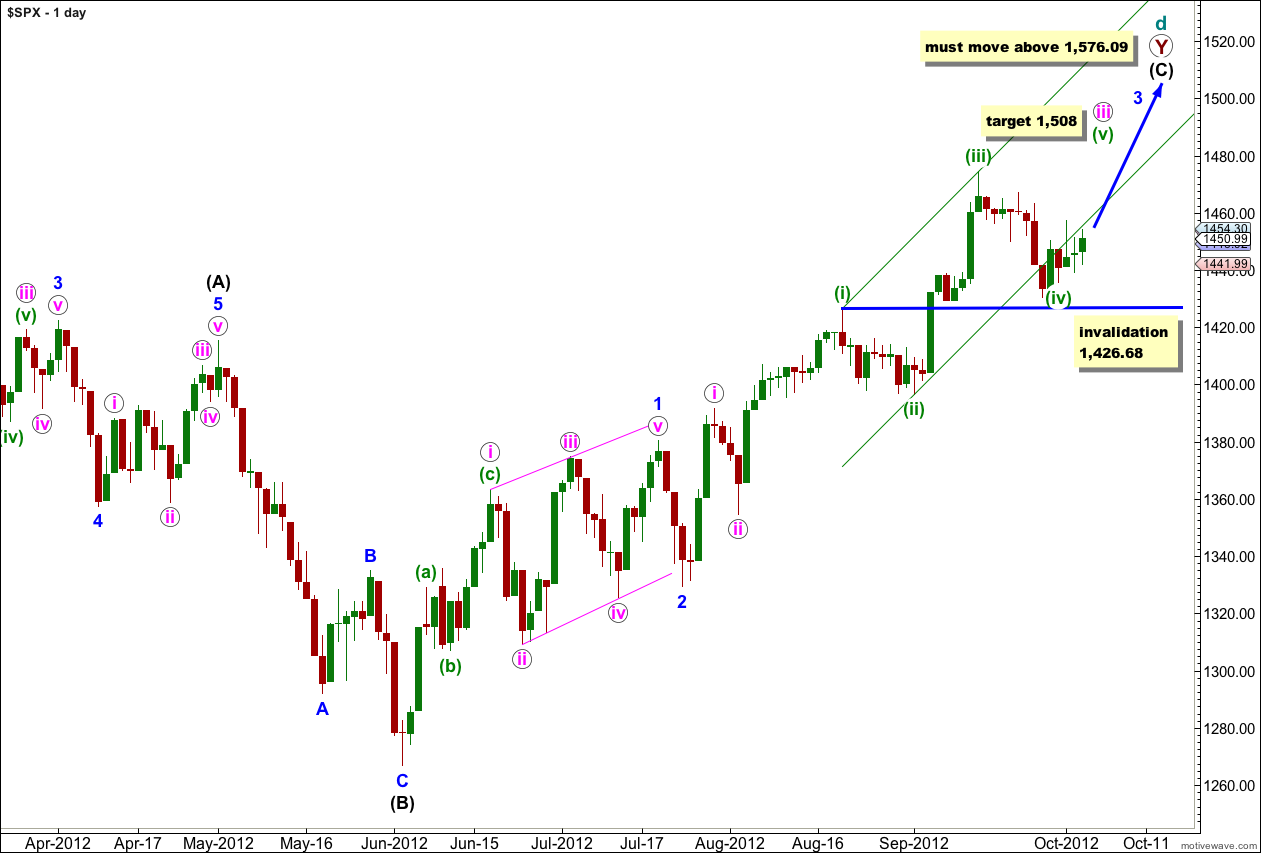
At super cycle degree this wave count sees a very rare expanding triangle unfolding, and cycle wave d upwards within the triangle is a double zigzag which must move beyond the end of cycle wave b.
Within the second zigzag of the double, primary wave Y, wave (C) black must unfold as a five wave structure.
Waves 1 and 2 blue are complete. At this stage wave 3 blue is unfolding upwards as an impulse and may have an extension in the middle of it.
When wave iii pink is complete we shall expect a correction for wave iv pink to last about a week or so.
When wave 3 blue is complete we shall expect a correction for wave 4 blue which should last about one to three weeks. At that stage this wave count will not expect price to move back into wave 1 blue price territory. The invalidation point would be at 1,380.39. The alternate below would expect price to move below this point. At that stage the wave counts would diverge and 1,380.39 is the price point which differentiates them.
Within wave iii pink at 1,508 wave (v) green would reach equality in length with wave (i) green.
Any further downwards movement for wave (iv) green may not move into wave (i) green price territory. This wave count is invalidated with movement below 1,426.68.
First Daily Wave Count – Alternate.
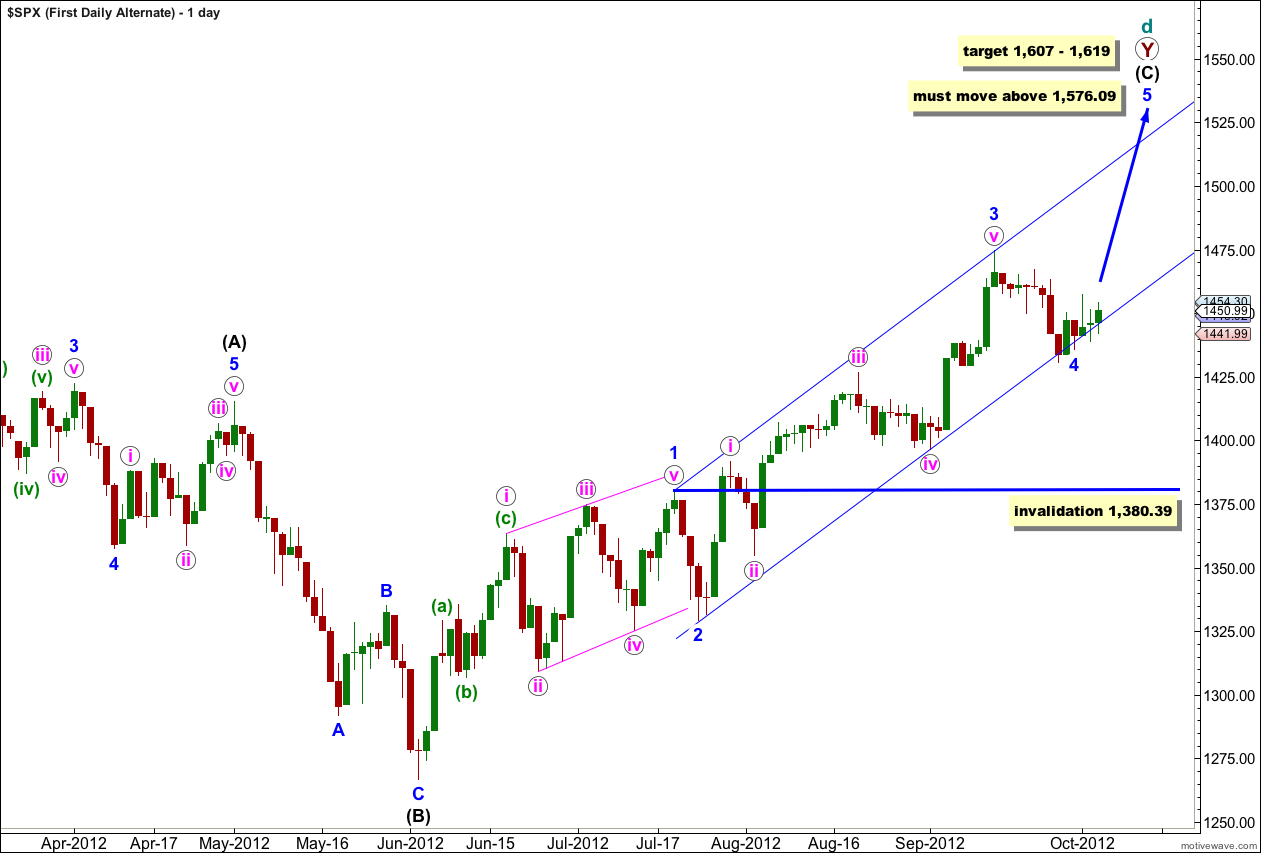
This is an alternate way of looking at upwards movement from the low labeled 2 blue. It is possible that wave 3 blue is a complete impulse and that downwards movement this week is wave 4 blue.
At this stage it is too early to confirm an end to the correction labeled 4 blue. If this correction continues further as a double or a flat then it may not move into wave 1 blue price territory. This wave count is invalidated with movement below 1,380.39.
Wave 3 blue has no Fibonacci ratio to wave 1 blue which means wave 5 blue is more likely to exhibit a Fibonacci ratio to either of 1 or 3 blue. At 1,619 wave 5 blue would reach 1.618 the length of wave 1 blue.
At 1,607 wave (C) black would reach equality in length with wave (A) black.
Wave (A) black lasted 164 days. Wave (C) black has so far lasted 84 days. Wave (C) black would reach equality in duration with wave (A) black in another 80 days.
This alternate has a lower probability because it does not work for the Dow. On the Dow there is too much overlapping for this idea to fit. I would expect the S&P 500 and the Dow to turn reasonably closely together, although they do not always do so, which is why I’m considering this alternate for the S&P 500.
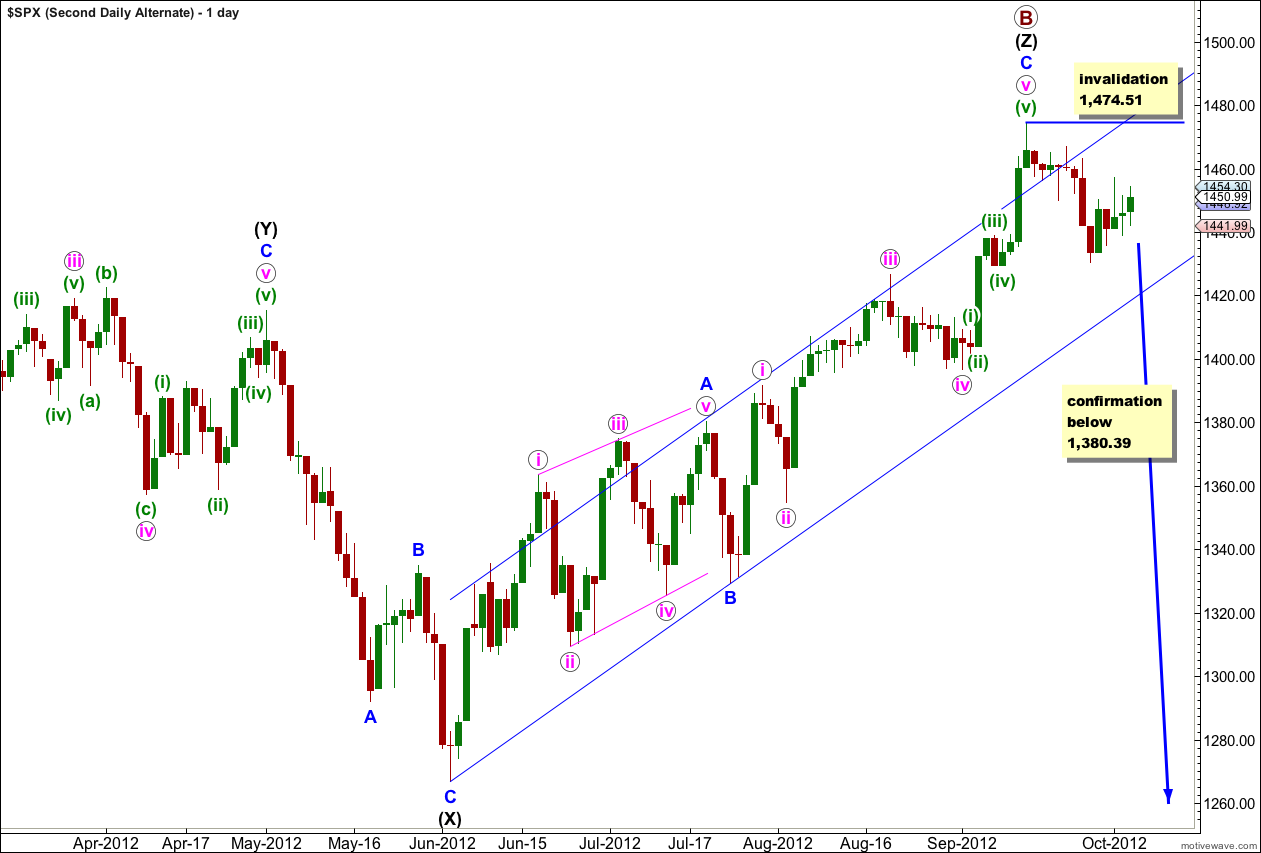
Second Daily Wave Count.
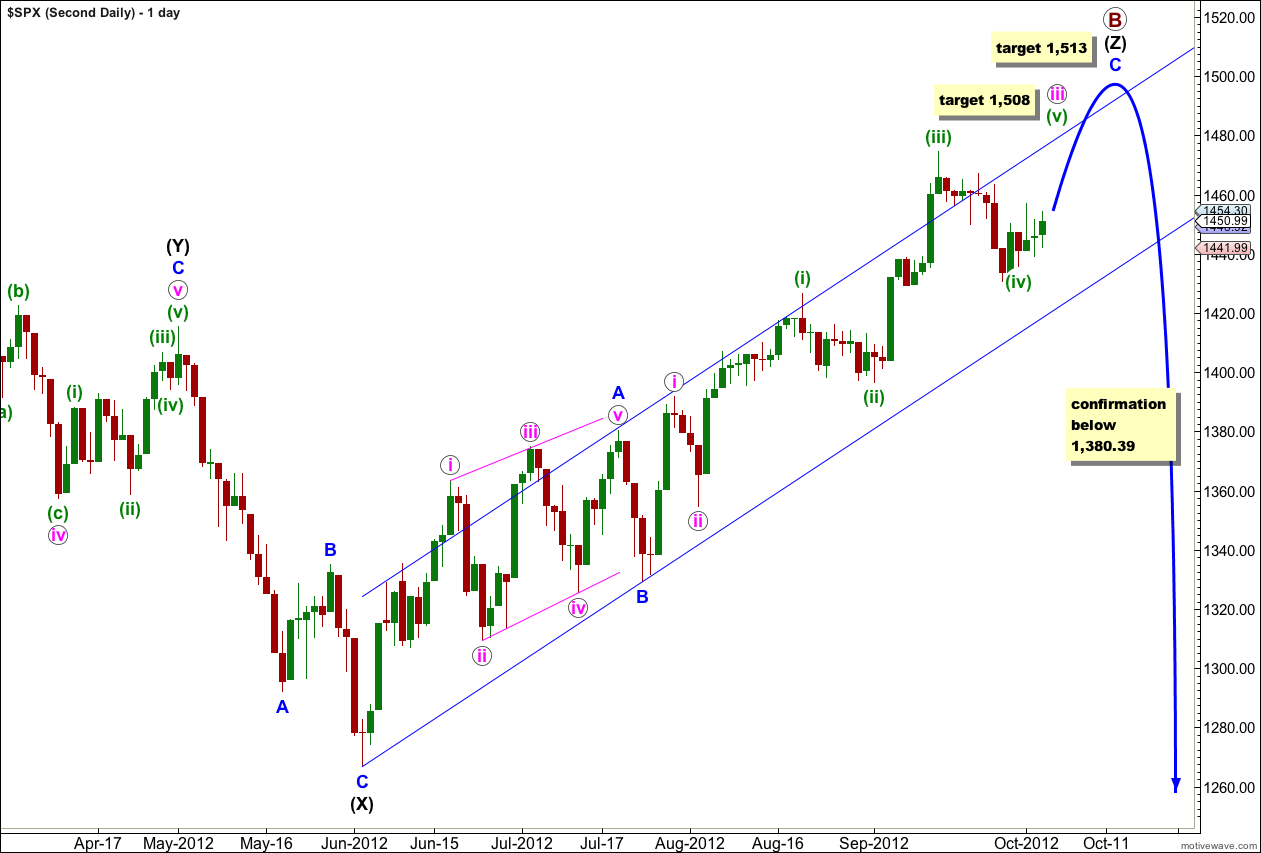
At grand super cycle degree this wave count sees a double flat correction unfolding, which is a common structure. The second flat in the double has begun. Within a flat the A wave must subdivide into a three wave structure, so here at cycle degree a three wave flat is unfolding. Within cycle wave a primary wave A is complete and primary wave B may be incomplete.
At 1,508 wave (v) green would reach equality in length with wave (i) green.
Thereafter, a fourth wave correction for wave iv pink should last about a week or so.
Further upwards movement for wave v pink would complete this wave count at all degrees. At 1,513 wave C blue would reach 1.618 the length of wave A blue.
Thereafter, movement below 1,380.39 would take price back into what is wave 1 blue price territory for the first monthly wave count, and that would tip the balance in favour of this second wave count.
Hourly Wave Count.
At the hourly chart level, at this stage, the hourly wave counts apply to both the first two daily charts and the second daily chart:
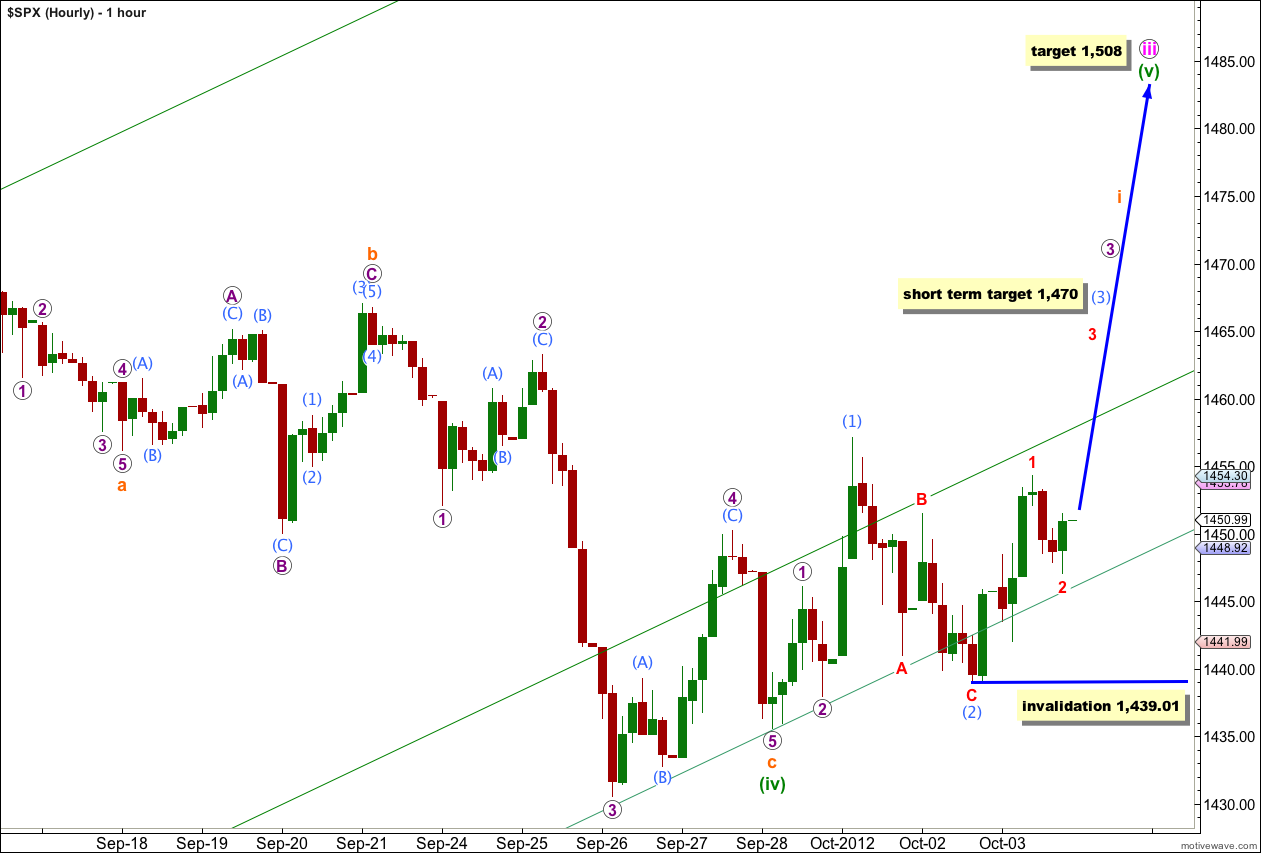
The main and alternate hourly wave counts expect the same direction next and have the same invalidation point. The momentum expected and targets are different.
This main wave count expects wave i orange to be subdividing into an impulse.
It is still possible that we have a series of overlapping first and second waves developing upwards. This is actually a very common situation and this wave count remains valid, despite the lack of upwards momentum. The implications are important. We must be aware that if this wave count is correct we could see upwards momentum increase significantly.
At 1,470 wave (3) aqua would reach 1.618 the length of wave (1) aqua.
Within wave (3) aqua wave 2 red may not move beyond the start of wave 1 red. This wave count is invalidated with movement below 1,439.01.
Hourly Wave Count – Alternate.
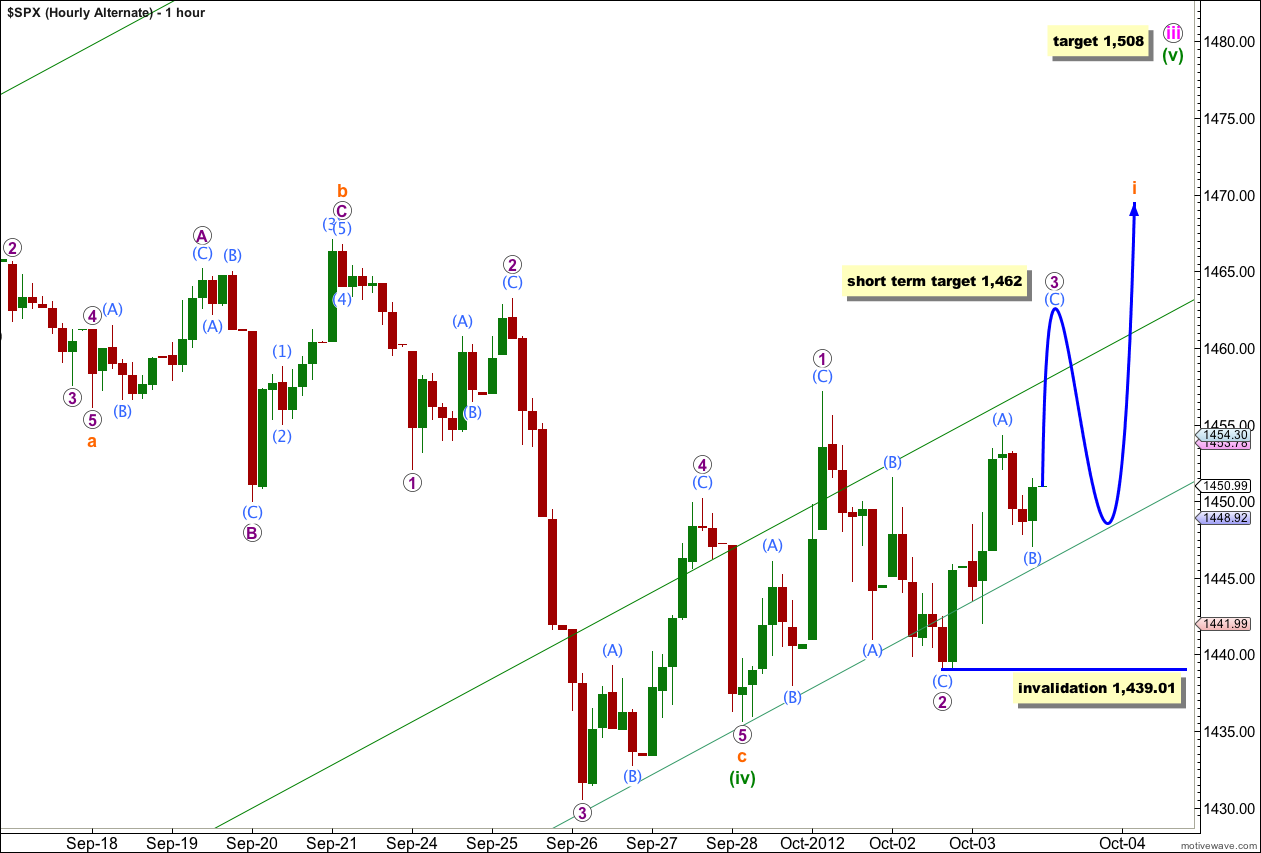
This alternate wave count expects wave i orange to subdivide into a leading diagonal.
Within a leading diagonal waves 2 and 4 must subdivide into zigzags. Waves 1, 3 and 5 are normally zigzags but may also be impulses.
Wave 3 purple would most likely be a zigzag. If it is then at 1,462 wave (C) aqua would reach equality in length with wave (A) aqua.
Thereafter, wave 4 purple must overlap into wave 1 purple price territory, but may not move beyond the end of wave 2 purple. This wave count is invalidated with movement below 1,439.01.
This wave count also expects upwards movement tomorrow but not with the same strong momentum as the main hourly wave count does.
Second Daily Wave Count – Alternate.
It remains possible, but unlikely, that primary wave B is over and we have recently seen a large trend change.
We should always assume that the trend remains the same, until proven otherwise. At this stage we have absolutely no confirmation of a trend change. We will not have confirmation until price moves below 1,380.39 invalidating the main wave count.
I publish this chart so that we aware of this possibility. We should not rely upon it without confirmation.
Within the new downwards trend no second wave correction may move beyond the start of the first wave. This wave count is invalidated with any movement above 1,474.51.
Not only does this wave count not work for the Dow but it now does not work on the hourly chart level either. I cannot, at this stage, see an explanation for movement above 1,456.13 if we have a new downwards trend.