
Last analysis expected to see a small upwards push before overall downwards movement in a low degree second wave correction. Price did not begin with upwards movement but did move lower during Friday’s session.
The wave counts are the same. Targets are the same and the overall expectation for direction next week is the same.
At the monthly chart level the wave counts differ at cycle and super cycle degree. You may review monthly charts here.
The first and second daily wave counts below have about an even probability. At this stage they do not diverge.
Click on the charts below to enlarge.
First Daily Wave Count.
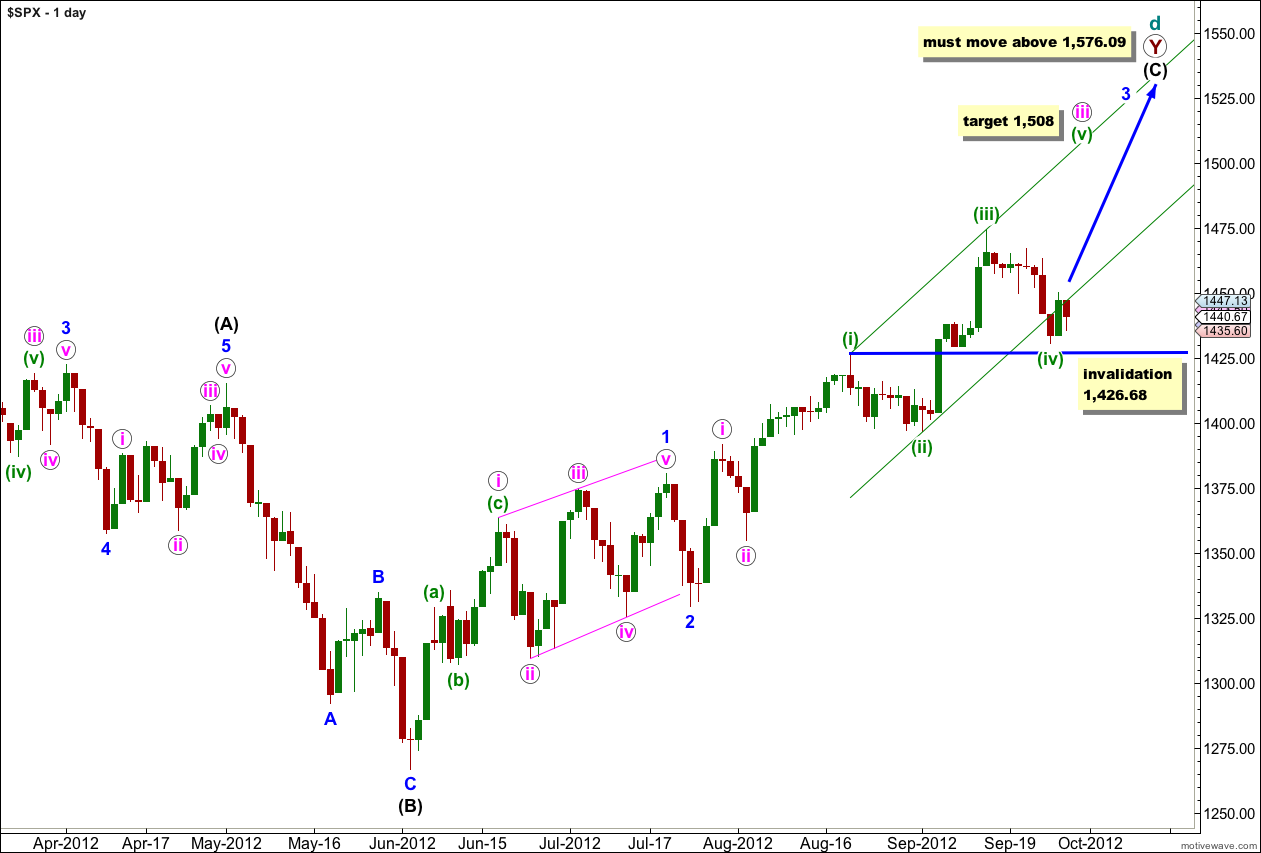
At super cycle degree this wave count sees a very rare expanding triangle unfolding, and cycle wave d upwards within the triangle is a double zigzag which must move beyond the end of cycle wave b.
Within the second zigzag of the double, primary wave Y, wave (C) black must unfold as a five wave structure.
Waves 1 and 2 blue are complete. At this stage wave 3 blue is unfolding upwards as an impulse and may have an extension in the middle of it.
When wave iii pink is complete we shall expect a correction for wave iv pink to last about a week or so.
When wave 3 blue is complete we shall expect a correction for wave 4 blue which should last about one to three weeks. At that stage this wave count will not expect price to move back into wave 1 blue price territory. The invalidation point would be at 1,380.39. The alternate below would expect price to move below this point. At that stage the wave counts would diverge and 1,380.39 is the price point which differentiates them.
Within wave iii pink at 1,508 wave (v) green would reach equality in length with wave (iii) green.
Any further downwards movement for wave (iv) green may not move into wave (i) green price territory. This wave count is invalidated with movement below 1,426.68.
First Daily Wave Count – Alternate.
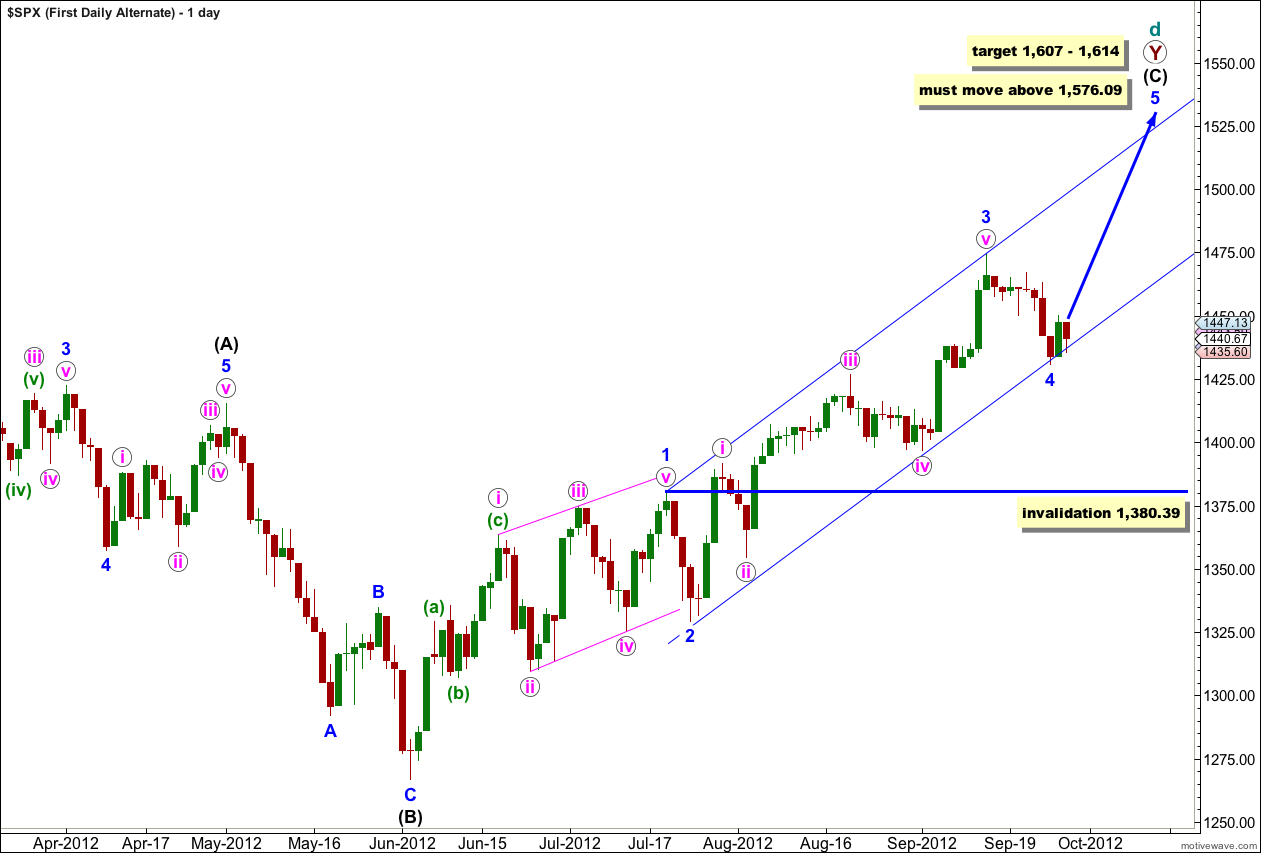
This is an alternate way of looking at upwards movement from the low labeled 2 blue. It is possible that wave 3 blue is a complete impulse and that downwards movement this week is wave 4 blue.
At this stage it is too early to confirm an end to the correction labeled 4 blue. If this correction continues further as a double or a flat then it may not move into wave 1 blue price territory. This wave count is invalidated with movement below 1,380.39.
Wave 3 blue has no Fibonacci ratio to wave 1 blue which means wave 5 blue is more likely to exhibit a Fibonacci ratio to either of 1 or 3 blue. At 1,614 wave 5 blue would reach 1.618 the length of wave 1 blue.
At 1,607 wave (C) black would reach equality in length with wave (A) black.
Wave (A) black lasted 164 days. Wave (C) black has so far lasted 82 days. Wave (C) black would reach equality in duration with wave (A) black in another 82 days.
Main Hourly Wave Count.
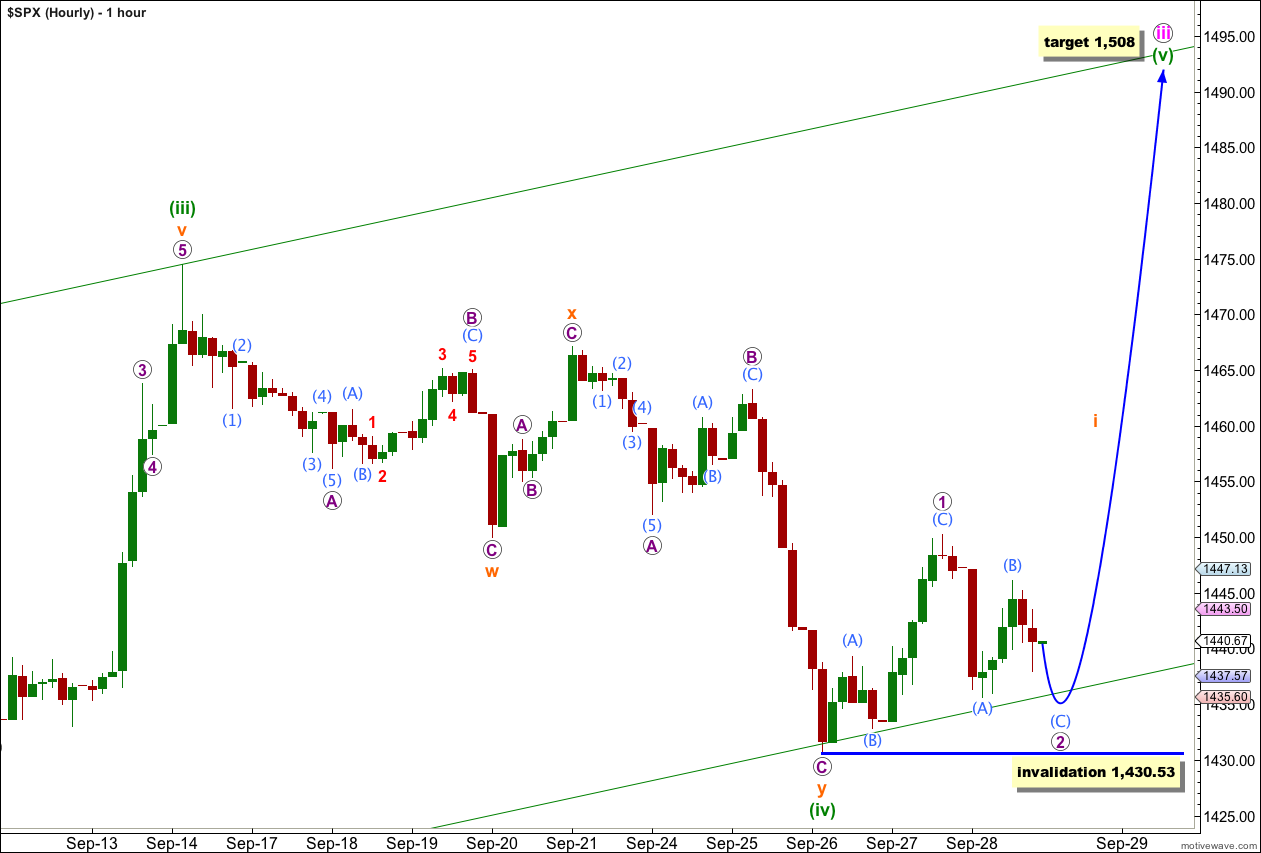
The first wave upwards, wave i orange, within wave (v) green, may be unfolding as a leading diagonal with the first wave labeled 1 purple a zigzag.
At this stage the upwards movement labeled wave (B) aqua looks most like a five on the 5 minute chart. Wave (B) aqua may not be over, or I may have that analysis wrong and it is a completed three. Either way further downwards movement would be required to complete a zigzag for wave 2 purple.
Wave 2 purple may not move beyond the start of wave 1 purple. This wave count is invalidated with movement below 1,430.53.
Hourly Alternate.
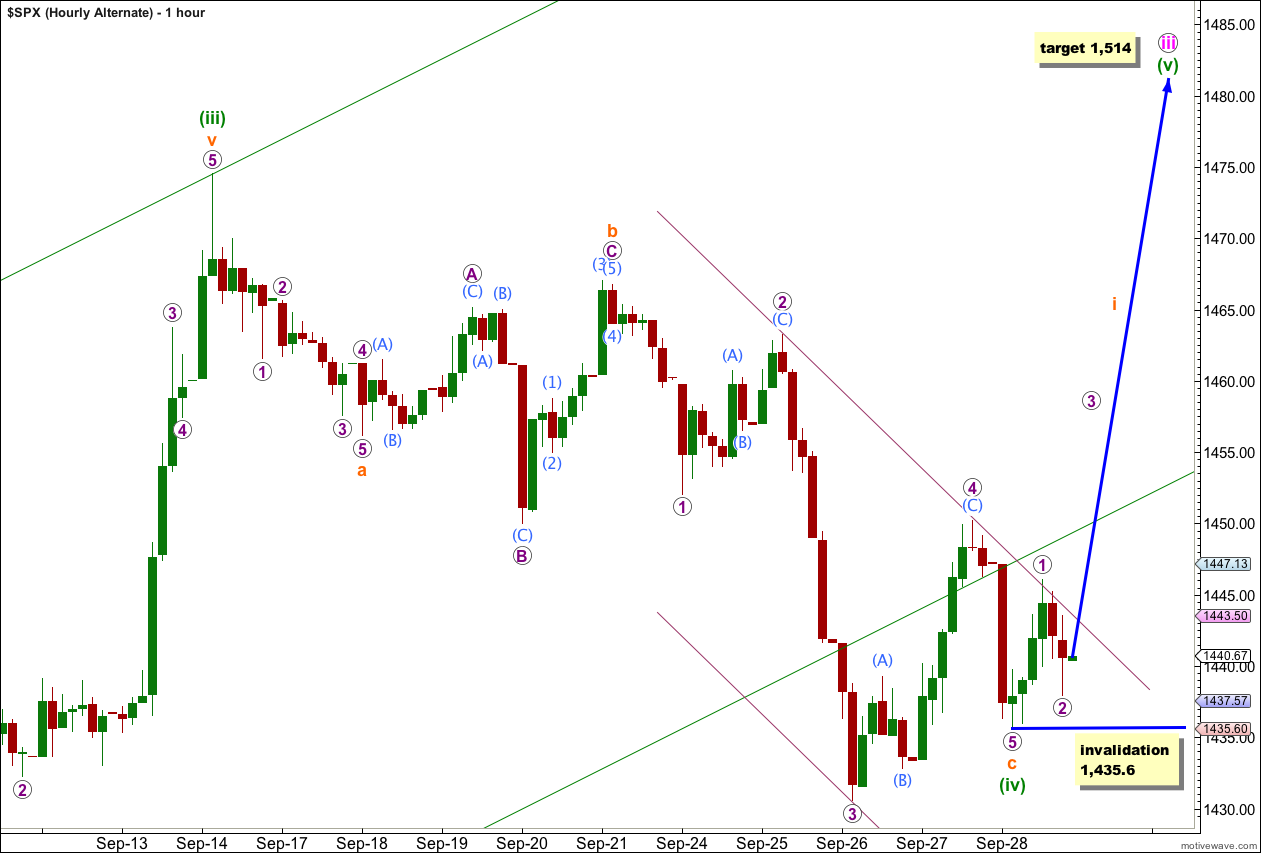
Alternately, wave (iv) green may have been a single zigzag with its C wave ending in a truncated fifth wave labeled 5 purple.
Because this alternate sees wave (iv) ending at a different price point the target for wave (v) green to end is different. At 1,514 wave (v) green would reach equality in length with wave (iii) green.
Although the probability of this wave count is lowered by the truncation the subdivisions for most recent movement at the end of wave c orange fit perfectly.
Upwards movement for wave 1 purple is a clear five wave structure on the 5 minute chart.
Wave 2 purple downwards may not be complete. If it moves lower it may not move beyond the start of wave 1 purple. This wave count is invalidated with movement below 1,435.6.
Second Daily Wave Count.
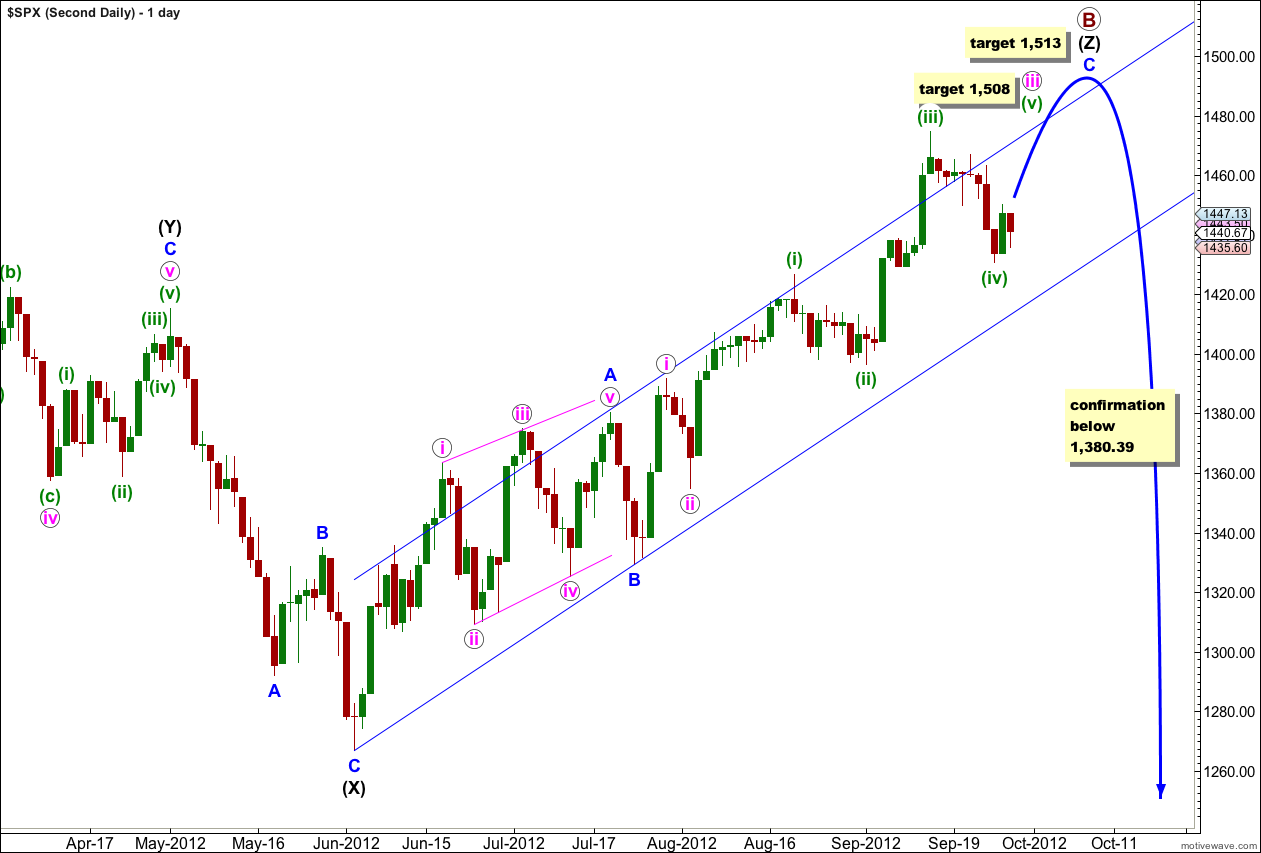
At grand super cycle degree this wave count sees a double flat correction unfolding, which is a common structure. The second flat in the double has begun. Within a flat the A wave must subdivide into a three wave structure, so here at cycle degree a three wave flat is unfolding. Within cycle wave a primary wave A is complete and primary wave B may be incomplete.
At 1,508 wave (v) green would reach equality in length with wave (iii) green.
Thereafter, a fourth wave correction for wave iv pink should last about a week or so.
Further upwards movement for wave v pink would complete this wave count at all degrees. At 1,513 wave C blue would reach 1.618 the length of wave A blue.
Thereafter, movement below 1,380.39 would take price back into what is wave 1 blue price territory for the first monthly wave count, and that would tip the balance in favour of this second wave count.
At the hourly chart level at this stage both this second wave count and the first wave count are the same. The two hourly charts above will suffice for this wave count also.
Second Daily Wave Count – Alternate.
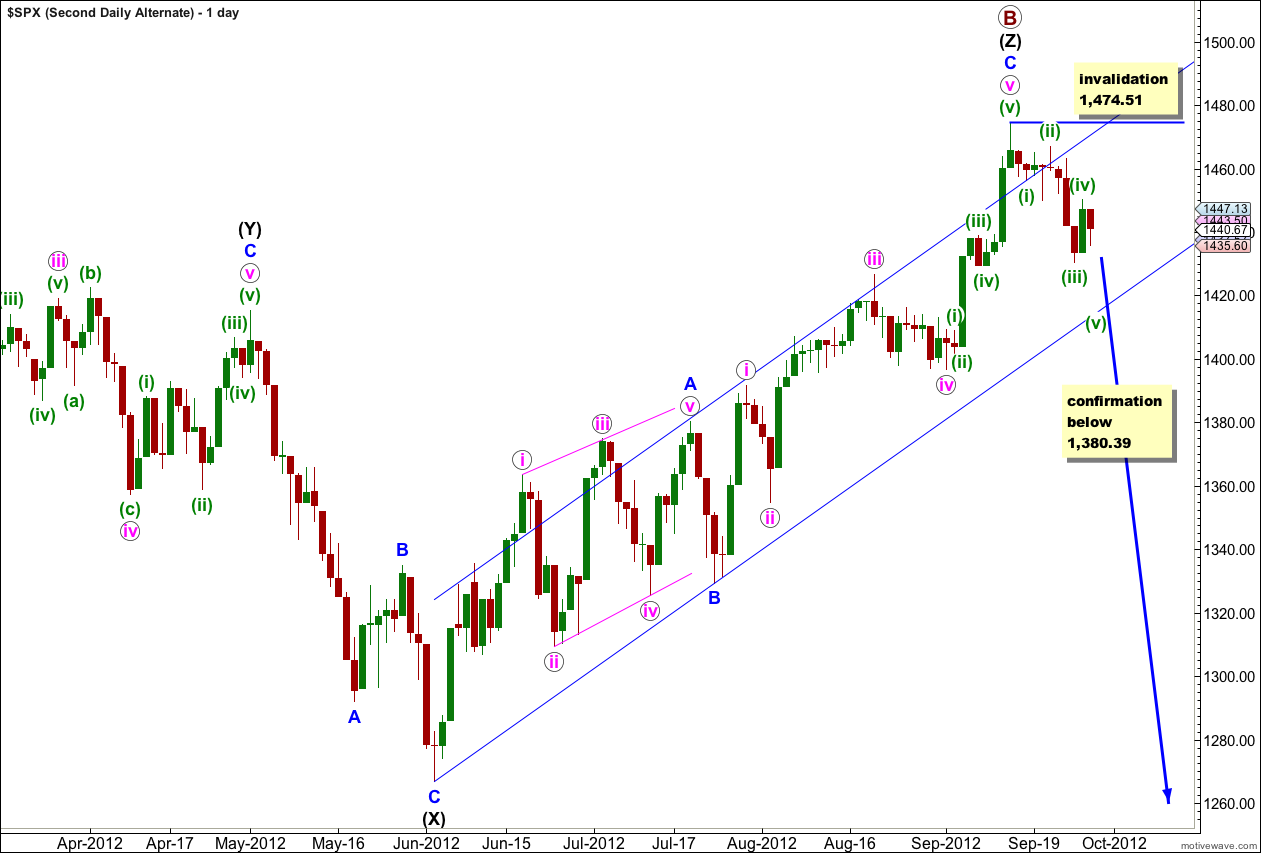
It remains possible, but unlikely, that primary wave B is over and we have recently seen a large trend change.
We should always assume that the trend remains the same, until proven otherwise. At this stage we have absolutely no confirmation of a trend change. We will not have confirmation until price moves below 1,380.39 invalidating the main wave count.
I publish this chart so that we aware of this possibility. We should not rely upon it without confirmation.
Within the new downwards trend no second wave correction may move beyond the start of the first wave. This wave count is invalidated with any movement above 1,474.51.