
Last week’s analysis expected overall upwards movement for the week, but price moved lower continuing a correction which was not over.
However, price remained above the invalidation point for the correction.
I have still the same first and second daily wave counts which have about an even probability. They differ at the monthly chart level. Monthly charts can be reviewed in the historic analysis category here.
Click on the charts below to enlarge.
First Daily Wave Count.
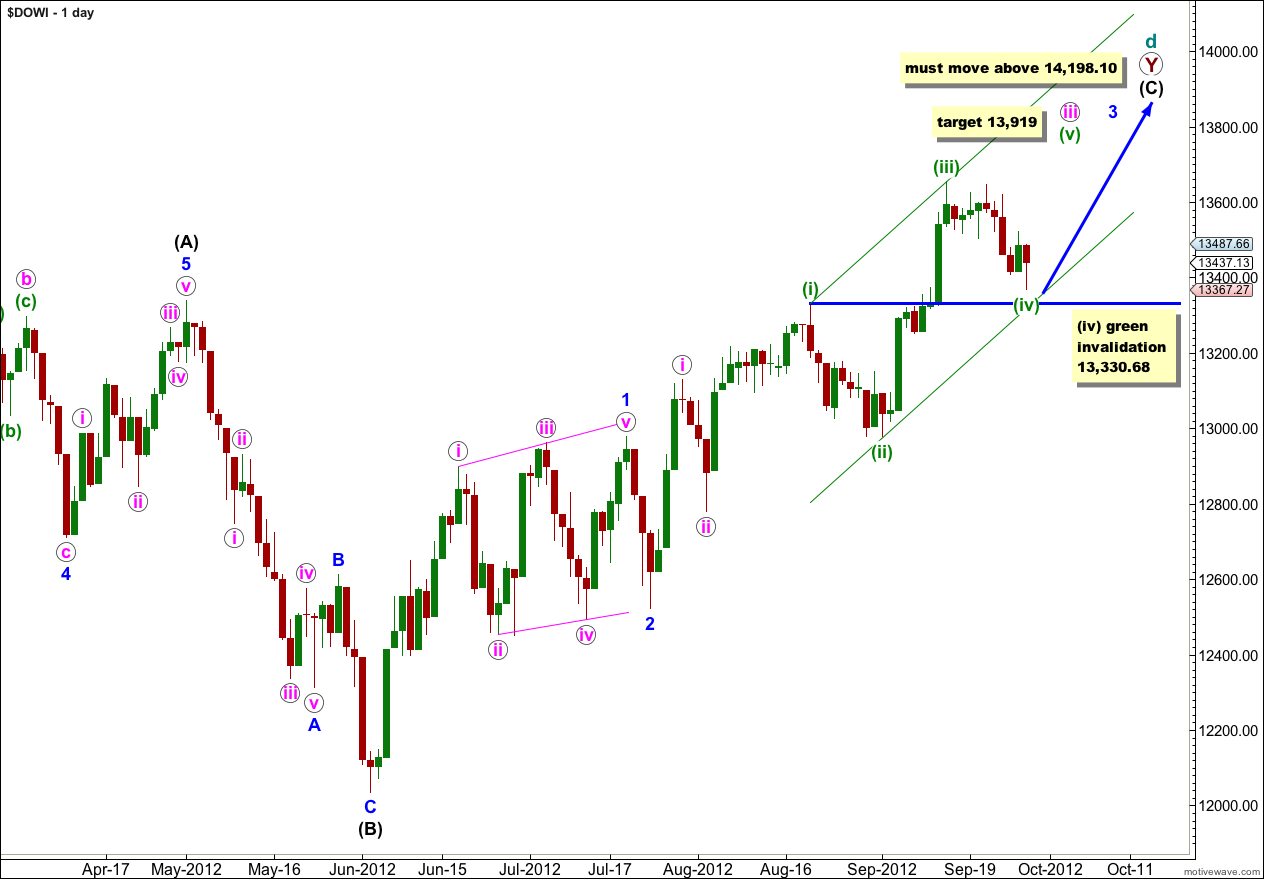
This first wave count looks at the possibility that the Dow is in a very large expanding triangle unfolding at super cycle degree. However, expanding triangles are the rarest of all Elliott wave structures.
The daily chart shows the subdivisions of wave (C) black which must subdivide into a five wave structure. It is subdividing as an impulse.
Within wave (C) black wave 3 blue is incomplete.
Within wave 3 blue wave iii pink is incomplete.
At 13,919 wave (v) green would reach equality in length with wave (i) green.
If wave (iv) green is incomplete and moves price sideways and slightly lower then it may not move into wave (i) green price territory. This wave count is invalidated with movement below 13,330.68
Main Hourly Wave Count.
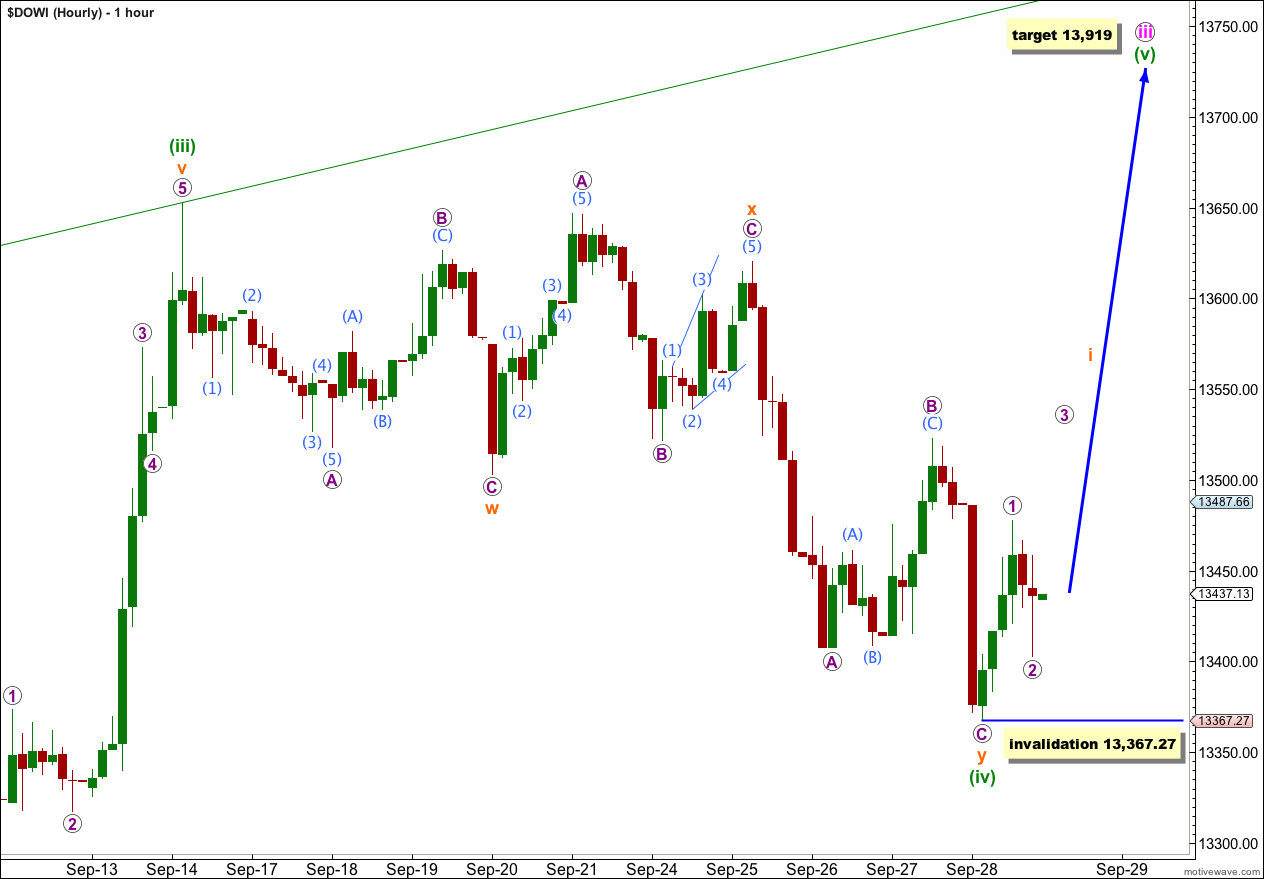
The correction of wave (iv) green may be over as a relatively common double zigzag.
Within the first zigzag, wave w orange, wave C purple is 11.95 points short of equality with wave A purple.
Wave x orange is a zigzag with a truncated C wave. The truncation reduces the probability of this wave count, but it still remains more likely than the alternate below.
Within wave x orange there is no Fibonacci ratio between waves A and C purple.
Within wave y orange there is no Fibonacci ratio between waves A and C purple.
The upwards movement at the end of last week labeled wave 1 purple subdivides perfectly as a five wave impulse on the 5 minute chart. The downwards movement labeled 2 purple in contrast looks typically corrective. It is most likely we saw a trend change during Friday’s session.
Wave 2 purple may not move beyond the start of wave 1 purple. This wave count is invalidated with movement below 13,367.27.
Alternate Hourly Wave Count.
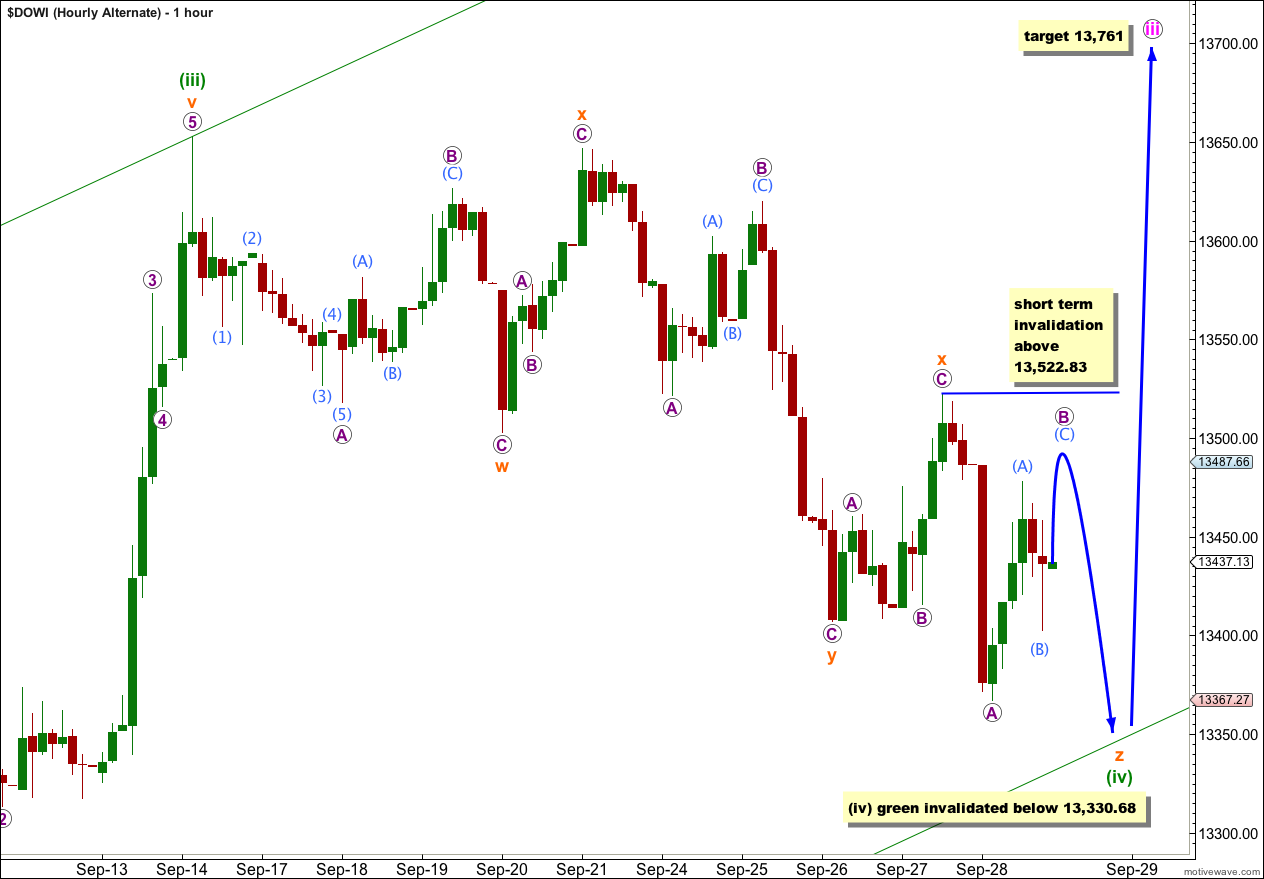
Alternatively, if wave (iv) green continues lower it may be unfolding as a rare triple zigzag. The rarity of triples reduces the probability of this wave count.
Within the final zigzag of wave z orange wave B purple is incomplete. Within a zigzag wave B purple may not move beyond the start of wave A purple. This wave count is invalidated in the short term with movement above 13,522.83.
I would expect wave (iv) green to find support at the lower edge of the parallel channel.
Wave (iv) green may not move into wave (i) green price territory. This wave count is invalidated with movement below 13,330.68.
Second Daily Wave Count.
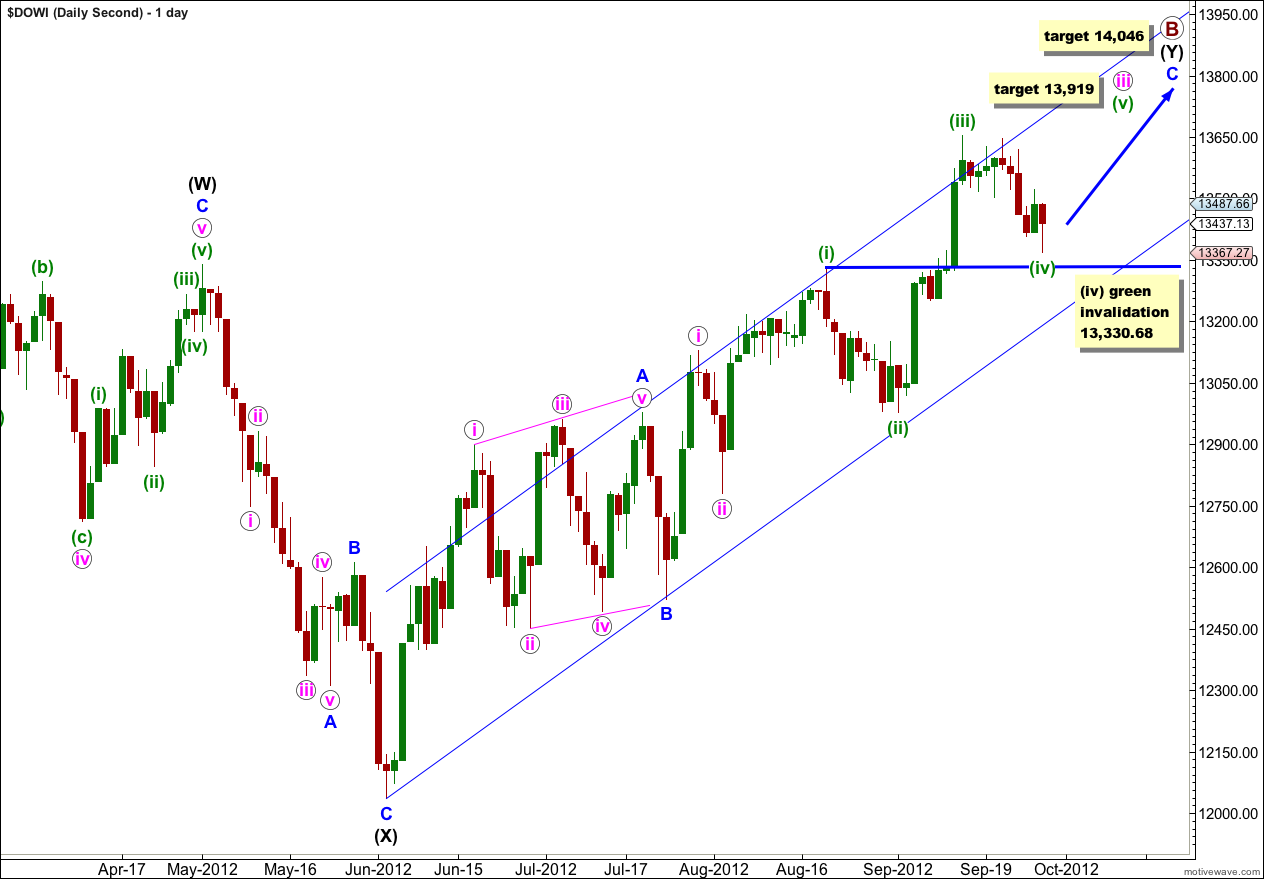
At the daily chart level this wave count has the same short and mid term expectation as the first wave count. It expects more upwards movement for the completion of a third wave. Thereafter, a fourth wave correction and for this wave count a final fifth wave upwards. Thereafter, the wave counts diverge and at that stage I will use an invalidation / confirmation point to differentiate between the two.
Wave C blue has already passed equality in length with wave A blue. The next target is at 14,046 where wave C blue would reach 1.618 the length of wave A blue.
Wave (iv) green may be over or it may continue slightly lower. If it does continue it may not move into wave (i) green price territory. This wave count is invalidated with movement below 13,330.68.
The two hourly charts above will suffice for this daily wave count also as both wave counts are the same at the hourly chart level at this time.