
Yesterday’s main hourly wave count expected upwards movement for Thursday’s session which is what happened.
I have still the same charts as yesterday for you. The targets are the same. The main hourly wave count is not confirmed but it has a much better look and a higher probability today.
The first and second daily wave counts still have about an even probability. They differ at monthly chart level, and at cycle degree. Monthly charts may be viewed here.
Click on the charts below to enlarge.
First Daily Wave Count.
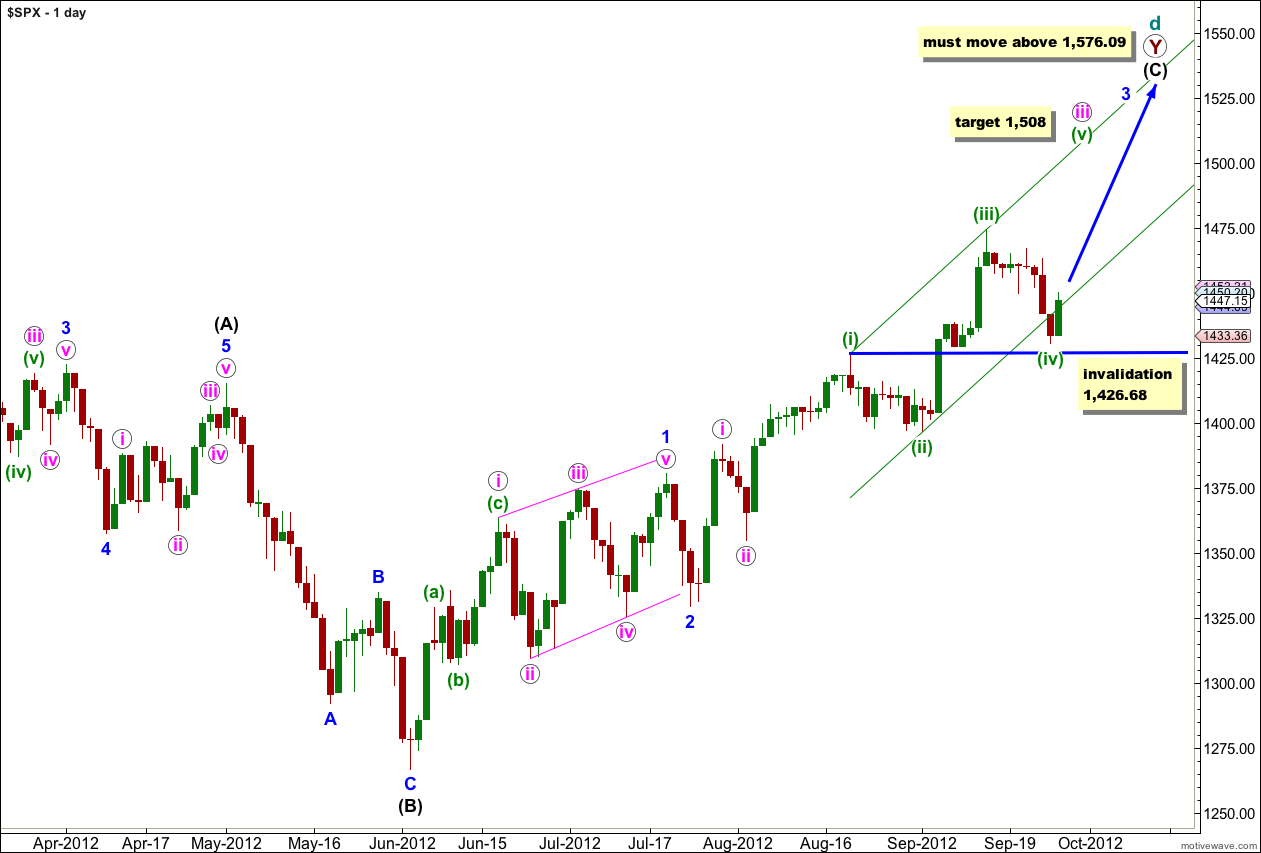
At super cycle degree this wave count sees a very rare expanding triangle unfolding, and cycle wave d upwards within the triangle is a double zigzag which must move beyond the end of cycle wave b.
Within the second zigzag of the double, primary wave Y, wave (C) black must unfold as a five wave structure.
Waves 1 and 2 blue are complete. At this stage wave 3 blue is unfolding upwards as an impulse and may have an extension in the middle of it.
When wave iii pink is complete we shall expect a correction for wave iv pink to last about a week or so.
When wave 3 blue is complete we shall expect a correction for wave 4 blue which should last about one to three weeks. At that stage this wave count will not expect price to move back into wave 1 blue price territory. The invalidation point would be at 1,380.39. The alternate below would expect price to move below this point. At that stage the wave counts would diverge and 1,380.39 is the price point which differentiates them.
Within wave iii pink at 1,508 wave (v) green would reach equality in length with wave (iii) green.
Any further downwards movement for wave (iv) green may not move into wave (i) green price territory. This wave count is invalidated with movement below 1,426.68.
First Daily Wave Count – Alternate.
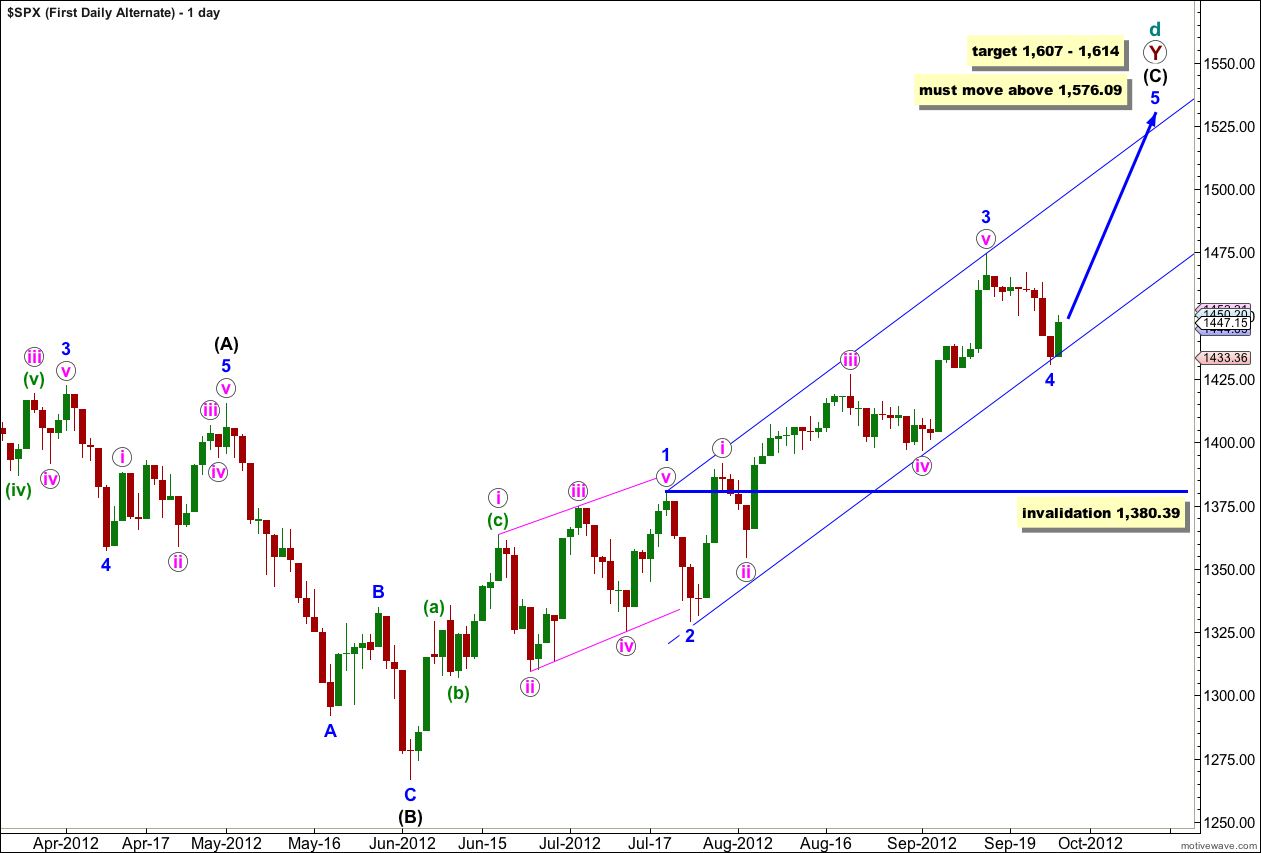
This is an alternate way of looking at upwards movement from the low labeled 2 blue. It is possible that wave 3 blue is a complete impulse and that downwards movement this week is wave 4 blue.
At this stage it is too early to confirm an end to the correction labeled 4 blue. If this correction continues further as a double or a flat then it may not move into wave 1 blue price territory. This wave count is invalidated with movement below 1,380.39.
Wave 3 blue has no Fibonacci ratio to wave 1 blue which means wave 5 blue is more likely to exhibit a Fibonacci ratio to either of 1 or 3 blue. At 1,614 wave 5 blue would reach 1.618 the length of wave 1 blue.
At 1,607 wave (C) black would reach equality in length with wave (A) black.
Wave (A) black lasted 164 days. Wave (C) black has so far lasted 81 days. Wave (C) black would reach equality in duration with wave (A) black in another 83 days.
Main Hourly Wave Count.
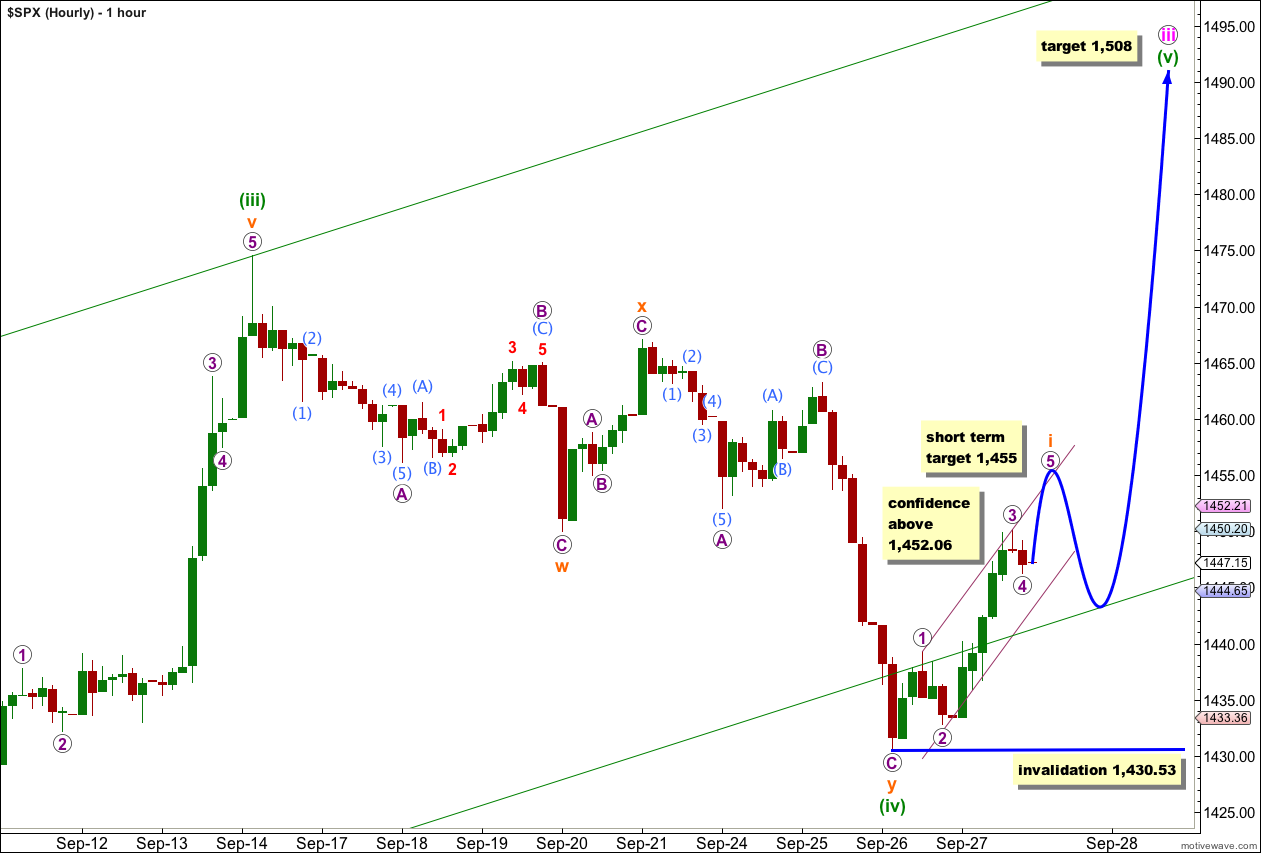
This hourly wave count has a higher probability than the alternate below. It sees the correction as a double zigzag structure which is complete.
Tomorrow we are likely to see first a little upwards movement for wave 5 purple to end wave i orange. At 1,455 wave 5 purple would reach equality in length with wave 1 purple.
Thereafter, wave ii orange should move price lower. Wave ii orange may not move beyond the start of wave i orange. This hourly wave count is invalidated with movement below 1,430.53. If this hourly wave count is invalidated with downwards movement then we shall use the alternate below.
Alternate Hourly Wave Count.
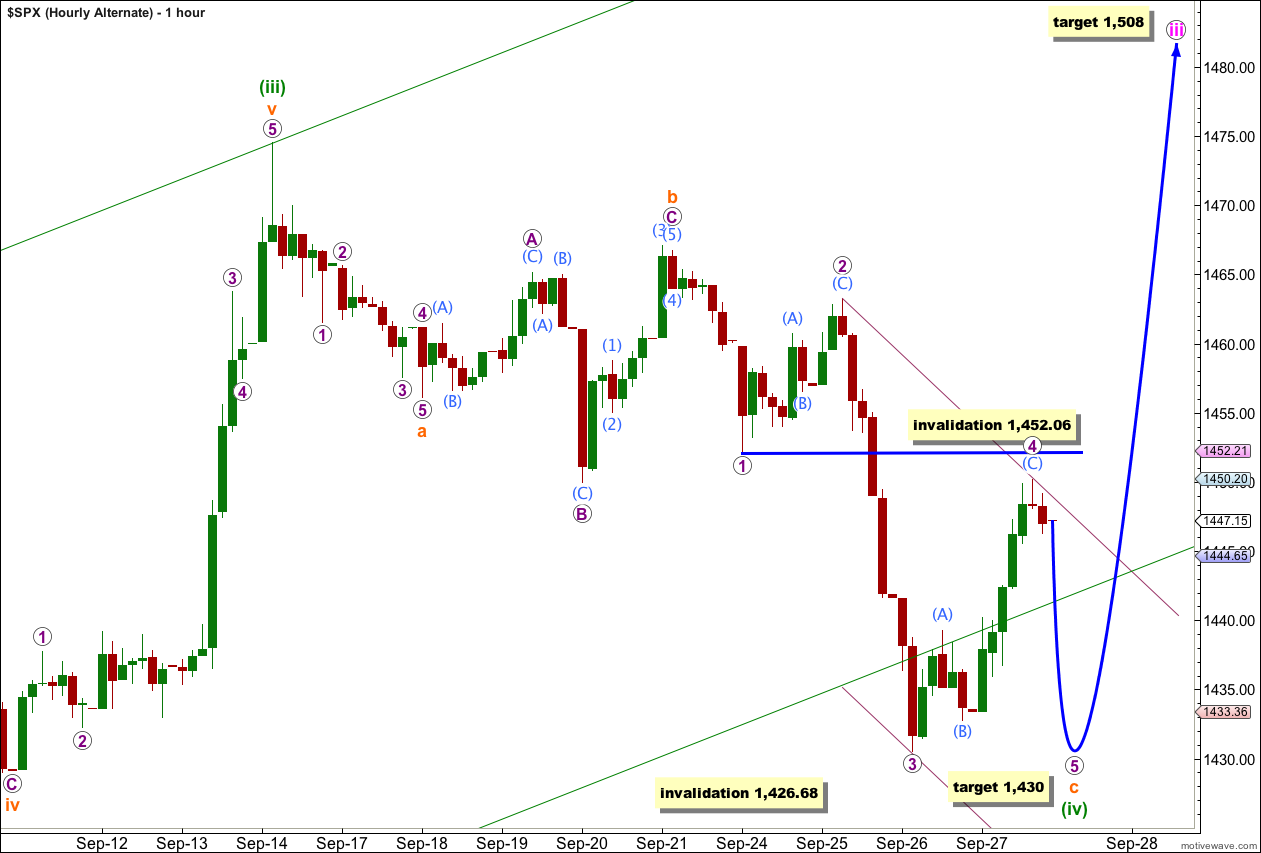
It remains possible that this fourth wave correction, whether it be at orange or blue degree, is incomplete. However, this alternate has a lower probability than the main hourly wave count because the subdivisions do not fit as well and it does not have as good a look.
Within wave b orange this alternate must see the upwards wave labeled C purple as a five wave impulse. The main hourly wave count sees this as a three which has a much better fit.
Within wave c orange downwards there is no alternation between waves 2 and 4 purple; they are both deep zigzag corrections. This reduces the probability of this wave count further.
Within wave c orange downwards a final fifth wave is required. At 1,430 wave 5 purple would reach 0.618 the length of wave 3 purple. This would bring price very slightly below the end of wave 3 purple at 1,430.53 which would avoid a truncation.
For this alternate wave 4 purple may not move into wave 1 purple price territory. This wave count is invalidated with movement above 1,452.06.
Second Daily Wave Count.
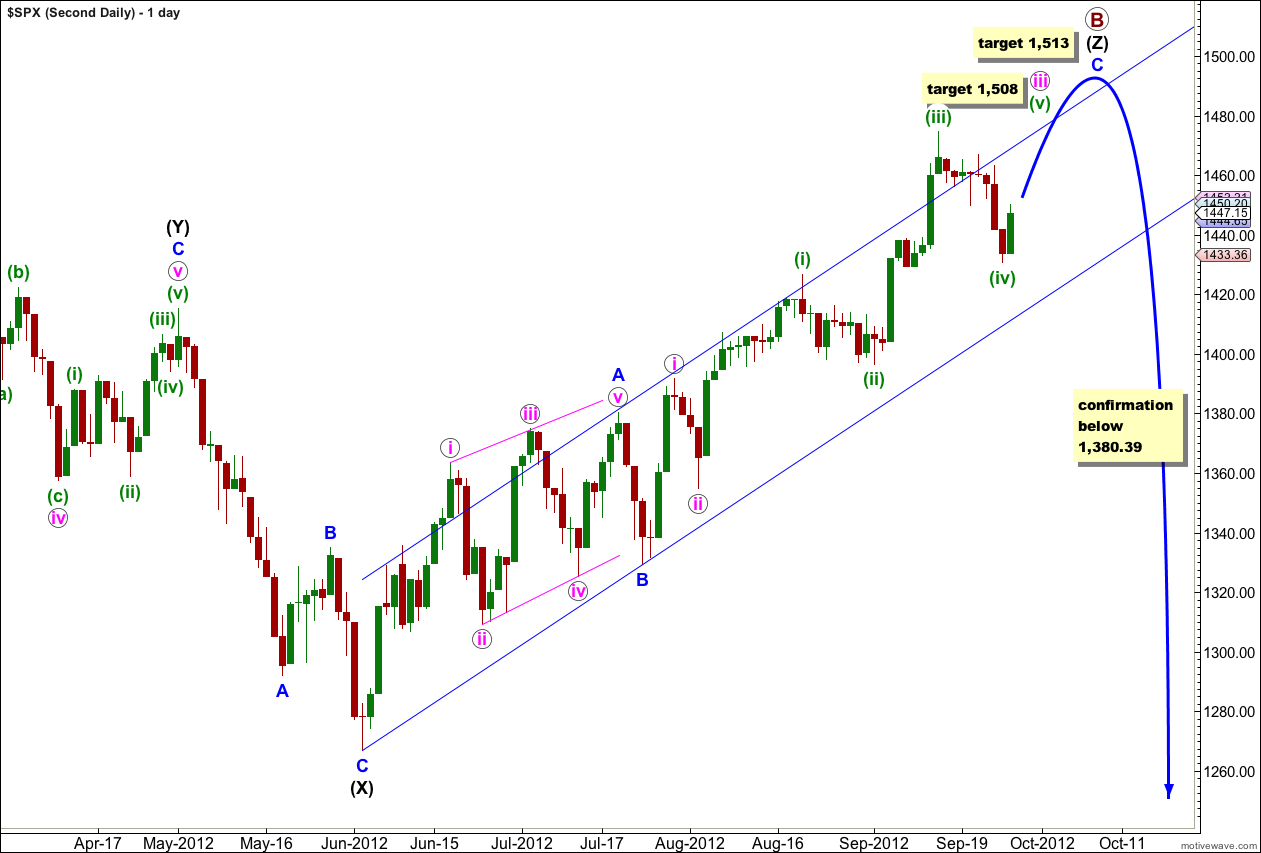
At grand super cycle degree this wave count sees a double flat correction unfolding, which is a common structure. The second flat in the double has begun. Within a flat the A wave must subdivide into a three wave structure, so here at cycle degree a three wave flat is unfolding. Within cycle wave a primary wave A is complete and primary wave B may be incomplete, or it may continue higher for a final fifth wave.
At 1,508 wave (v) green would reach equality in length with wave (iii) green.
Thereafter, a fourth wave correction for wave iv pink should last about a week or so.
Further upwards movement for wave v pink would complete this wave count at all degrees. At 1,513 wave C blue would reach 1.618 the length of wave A blue.
Thereafter, movement below 1,380.39 would take price back into what is wave 1 blue price territory for the first monthly wave count, and that would tip the balance in favour of this second wave count.
At the hourly chart level at this stage both this second wave count and the first wave count are the same. The two hourly charts above will suffice for this wave count also.
Second Daily Wave Count – Alternate.
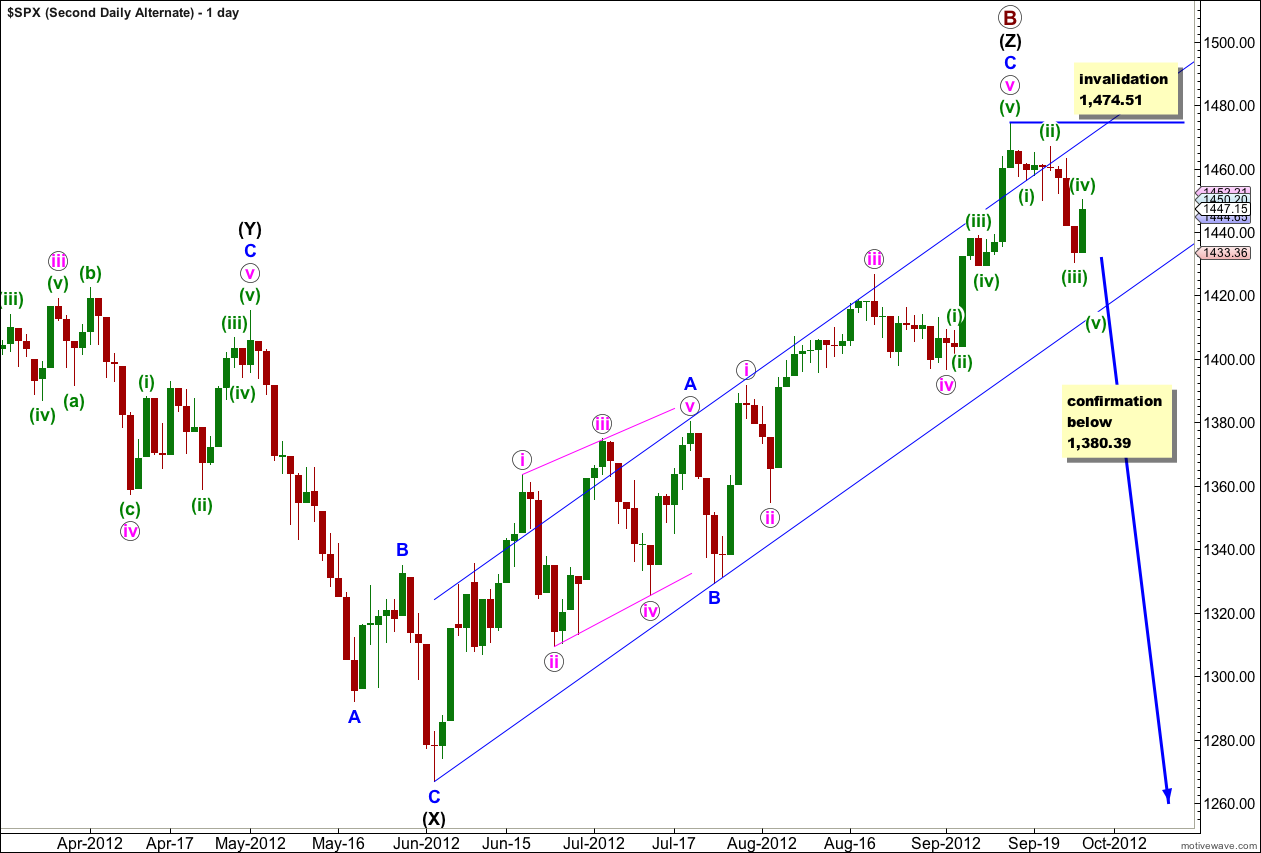
It remains possible, but unlikely, that primary wave B is over and we have recently seen a large trend change.
We should always assume that the trend remains the same, until proven otherwise. At this stage we have absolutely no confirmation of a trend change. We will not have confirmation until price moves below 1,380.39 invalidating the main wave count.
I publish this chart so that we aware of this possibility. We should not rely upon it without confirmation.
Within the new downwards trend no second wave correction may move beyond the start of the first wave. This wave count is invalidated with any movement above 1,474.51.