
Last analysis allowed for downwards movement as this correction extended lower. Price has remained above the invalidation point.
I have another interpretation of recent movement on the daily chart for you today. This interpretation is equally as valid and would explain a little more downwards movement before the main trend resumes.
Click on the charts below to enlarge.
First Wave Count.
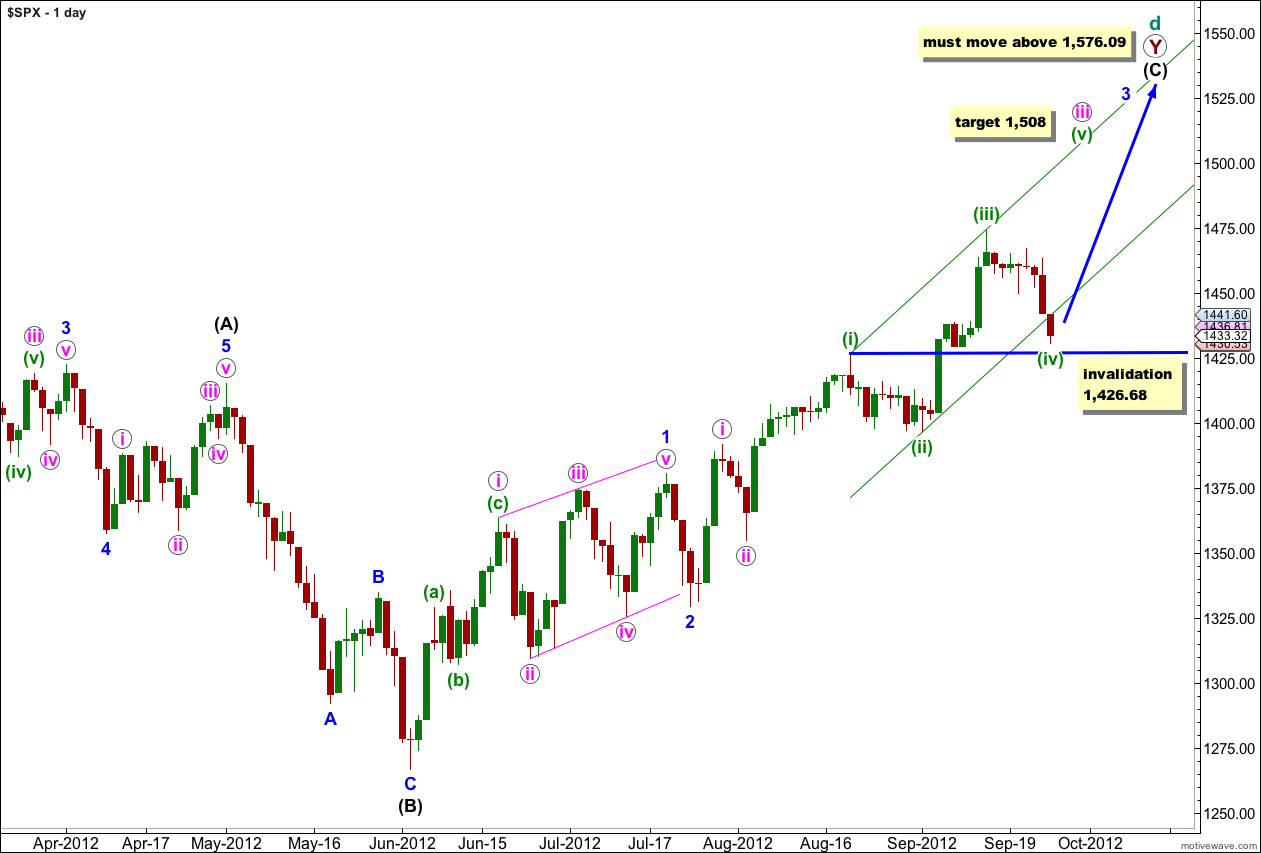
At super cycle degree this wave count sees a very rare expanding triangle unfolding, and cycle wave d upwards within the triangle is a double zigzag which must move beyond the end of cycle wave b.
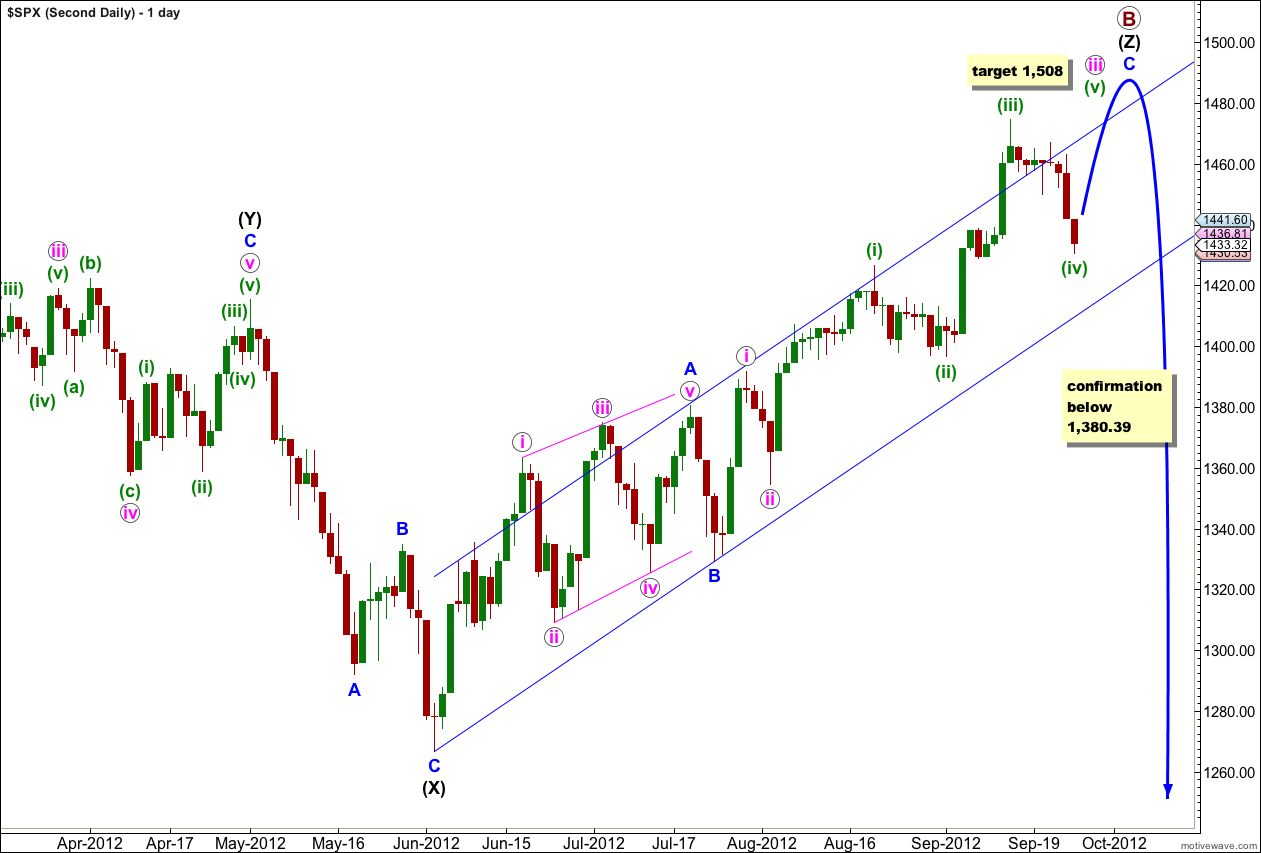
Within the second zigzag of the double, primary wave Y, wave (C) black must unfold as a five wave structure.
Waves 1 and 2 blue are complete. At this stage wave 3 blue is unfolding upwards as an impulse with an extension in the middle of it. When wave 3 blue is complete then we shall expect downwards movement for wave 4 blue. It is at this point that this first wave count diverges from the second wave count: the first wave count will expect price to not move back into wave 1 blue price territory below 1,380.39 while the second wave count would expect movement below this point. At that stage the price point 1,380.39 will differentiate which wave count is correct.
Within wave 3 blue at 1,518 wave iii pink would reach 2.618 the length of wave i pink.
At 1,508 wave (v) green would reach equality with wave (iii) green.
Any further downwards movement for wave (iv) green may not move into wave (i) green price territory. This wave count is invalidated with movement below 1,426.68.
If price moves below 1,426.68 then downwards movement may also be equally as likely to be wave 4 blue.
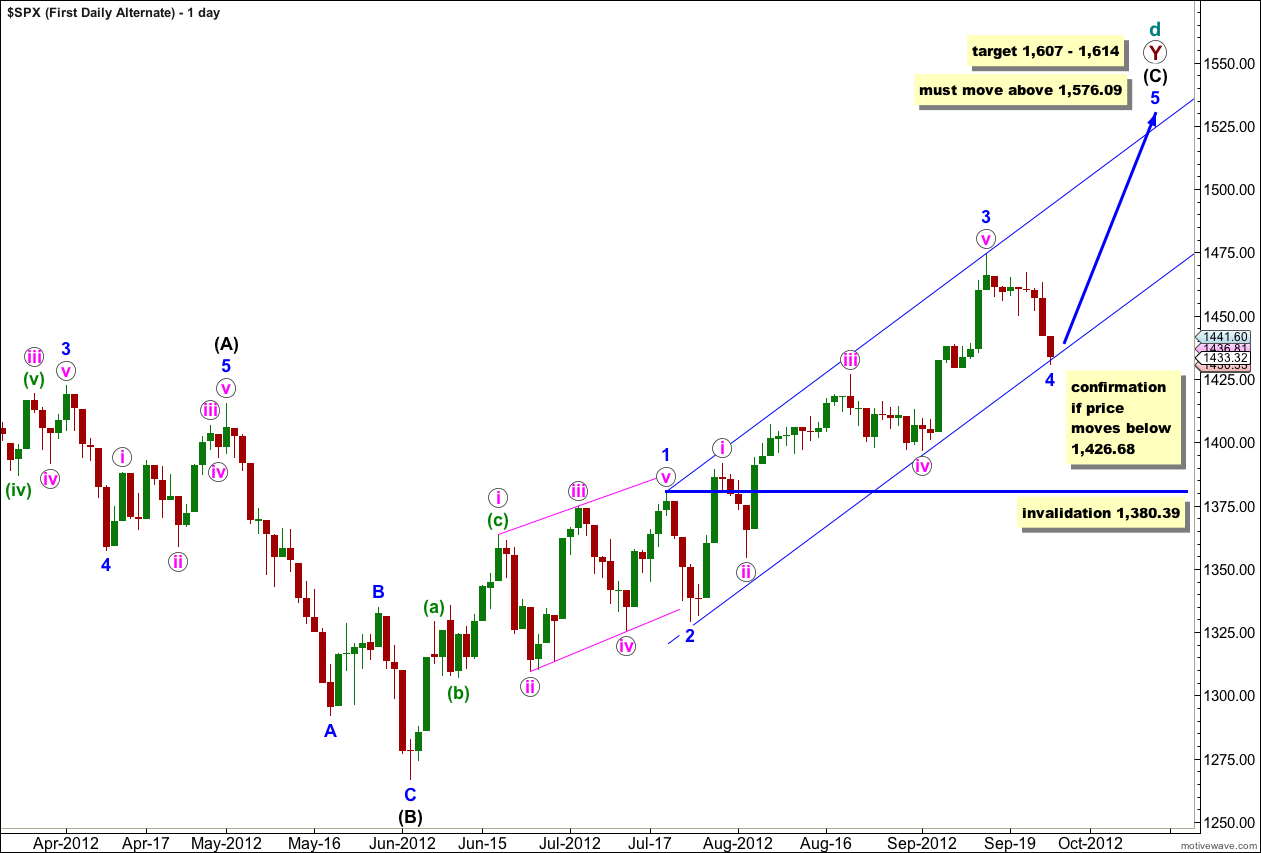
Wave 3 blue has no Fibonacci ratio to wave 1 blue which means wave 5 blue is more likely to exhibit a Fibonacci ratio to either of 1 or 3 blue. At 1,614 wave 5 blue would reach 1.618 the length of wave 1 blue.
At 1,607 wave (C) black would reach equality in length with wave (A) black.
Wave (A) black lasted 164 days. Wave (C) black has so far lasted 80 days. Wave (C) black would reach equality in duration with wave (A) black in another 84 days.
Wave 4 blue may not move into wave 1 blue price territory. This wave count is invalidated with movement below 1,380.39.
If this wave count were to be invalidated with downwards movement then the second daily chart which expects we have recently seen a trend change would be the preferred wave count.
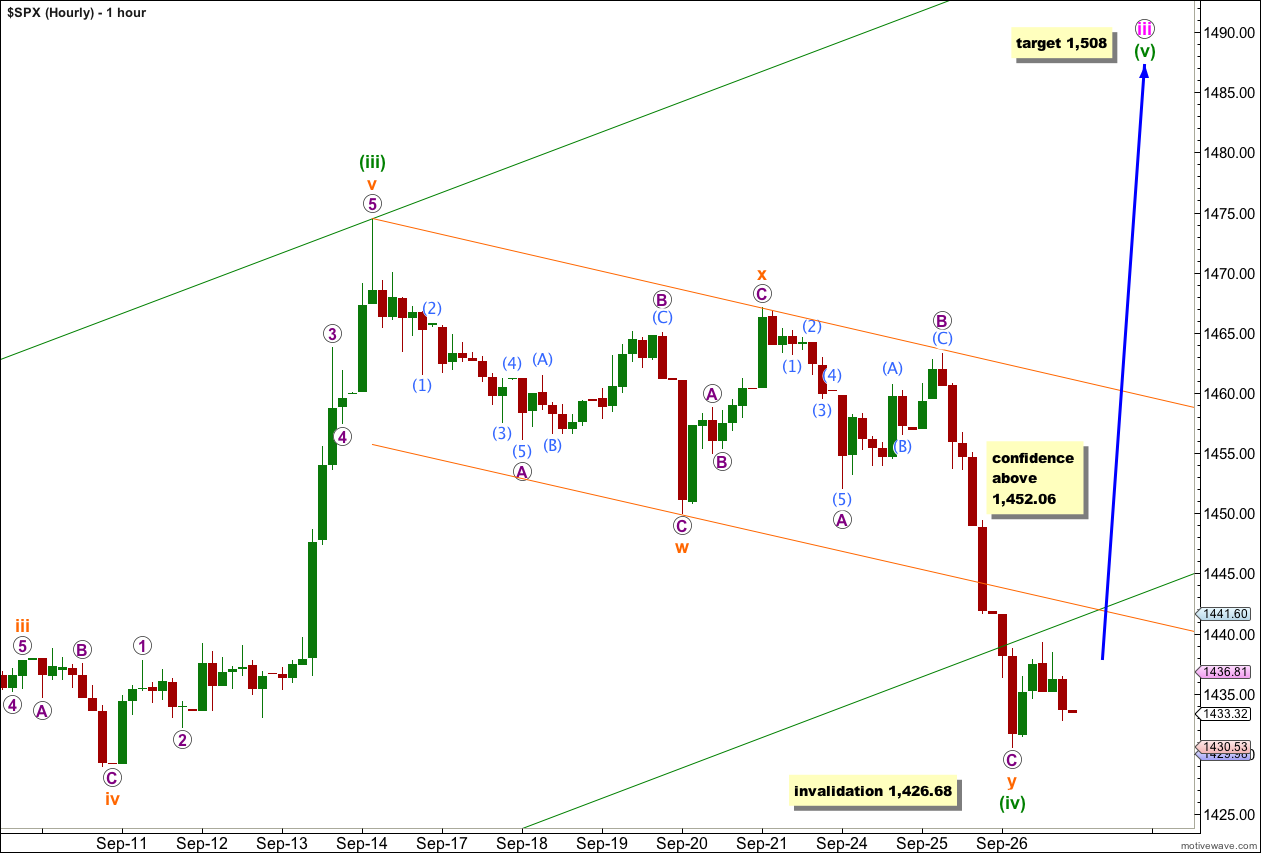
This hourly wave count and the alternate below are the same as yesterday.
If wave (iv) green is a double zigzag then it is most likely over here. The upwards movement at the end of Wednesday’s session subdivides best as a five on the 1 minute chart which supports an end to downwards movement.
At 1,508 wave (v) green would reach equality in length with wave (i) green.
We may have confidence that this correction is over and the upwards trend has resumed when price moves above 1,452.06.
Any further downwards movement may not move into wave (i) green price territory. This hourly wave count is invalidated with movement below 1,426.68.
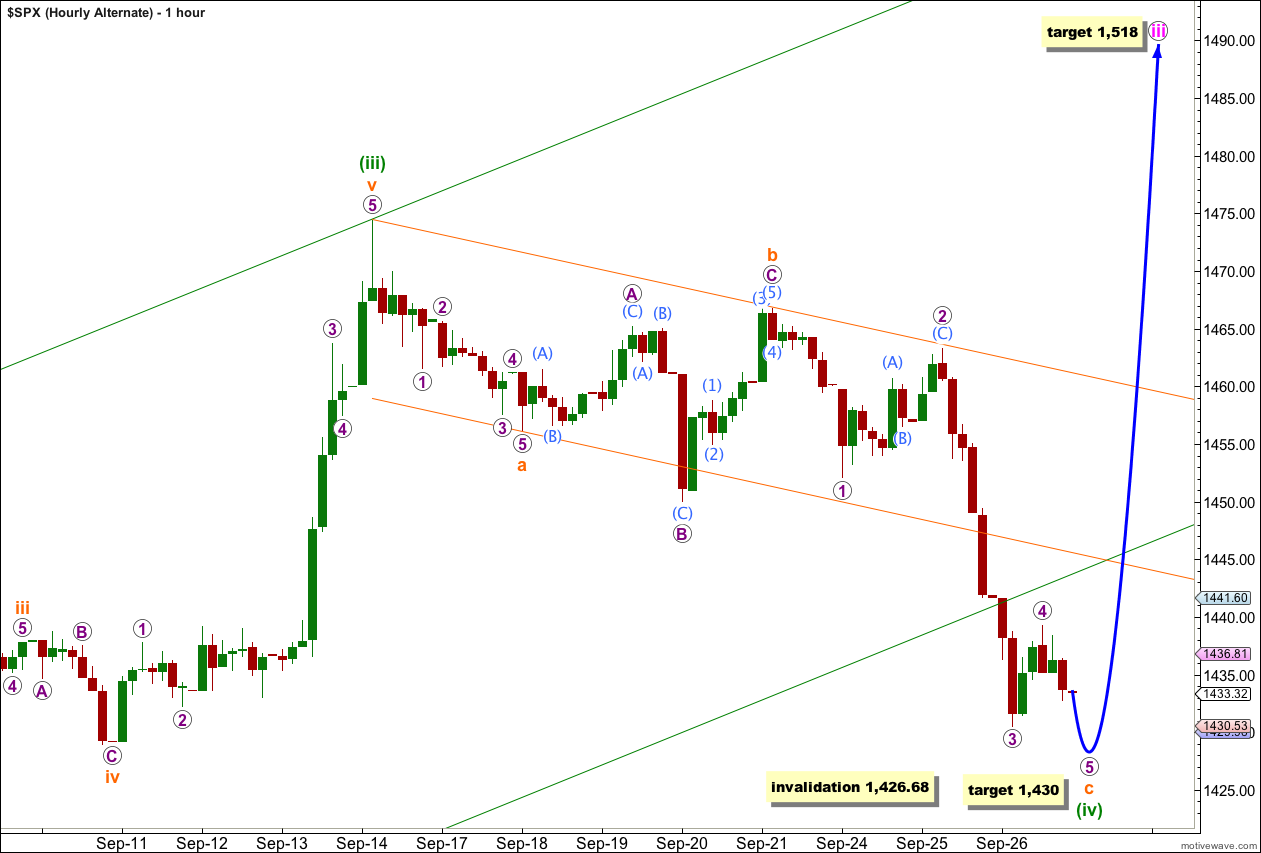
If wave (iv) green is unfolding as a single zigzag then the final wave c orange downwards is incomplete.
At 1,430 wave 5 purple would reach 0.618 the length of wave 1 purple and it would end about the same level as wave 3 purple at 1,430.53.
Wave (iv) green may not move into wave (i) green price territory. This wave count is invalidated with movement below 1,426.68.
Second Wave Count.
At grand super cycle degree this wave count sees a double flat correction unfolding, which is a common structure. The second flat in the double has begun. Within a flat the A wave must subdivide into a three wave structure, so here at cycle degree a three wave flat is unfolding. Within cycle wave a primary wave A is complete and primary wave B may be incomplete, or it may continue higher for a final fifth wave.
At 1,508 wave (v) green would reach equality in length with wave (i) green.
Thereafter, movement below 1,380.39 would take price back into what is wave 1 blue price territory for the first monthly wave count, and that would tip the balance in favour of this second wave count.
At the hourly chart level at this stage both this second wave count and the first wave count are the same. The two hourly charts above will suffice for this wave count also.
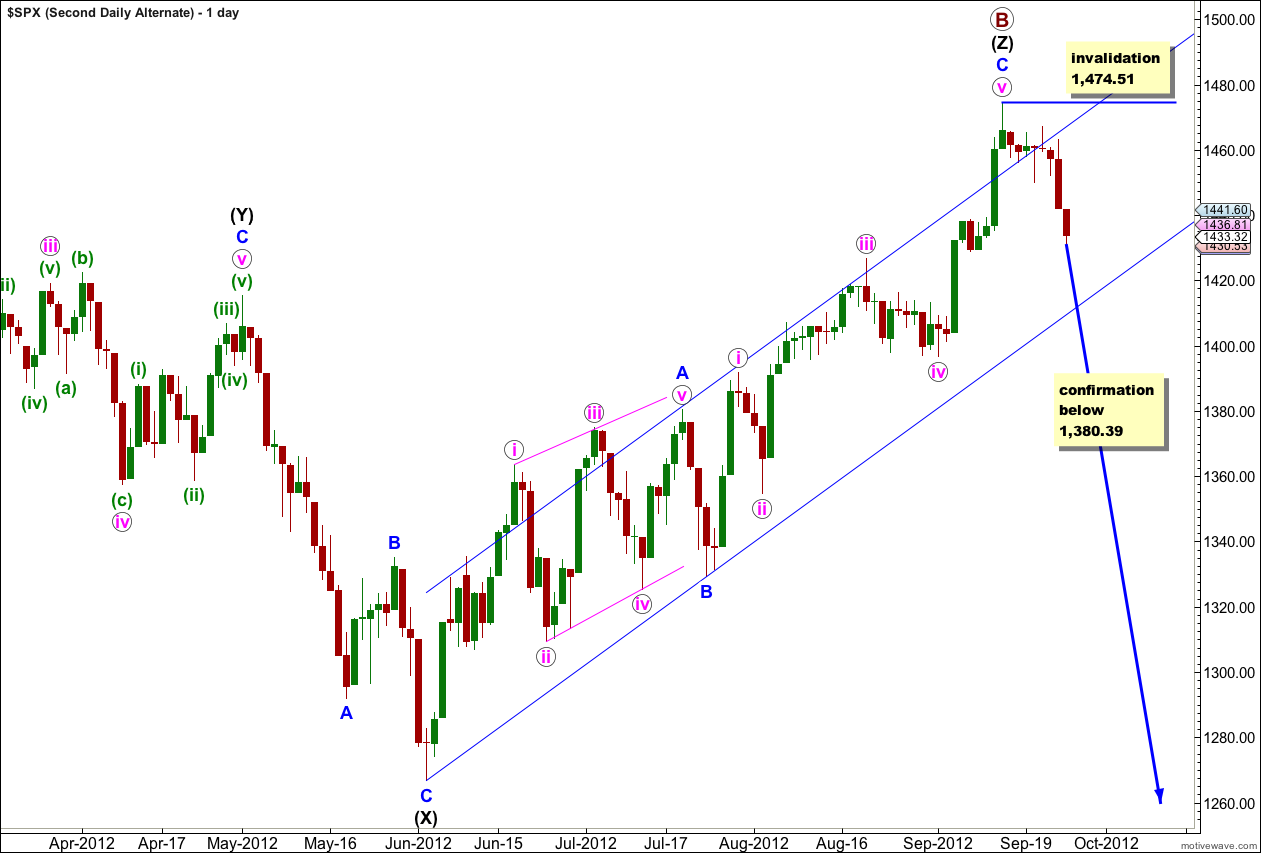
It remains possible that primary wave B is complete, just 10.98 points longer than 138% the length of primary wave A.
If we see movement below 1,380.39 in the next couple of weeks then this would be my preferred wave count. At this stage we have absolutely no confirmation of a trend change and so this possibility is simply one to be aware of and not to rely upon. We should always assume that the trend remains the same, until proven otherwise. “The trend is your friend.”