
Yesterday’s analysis had three hourly wave counts. Movement below 1,452.06 invalidated two of the wave counts.
The wave count which is correct expected downwards movement to find support at the lower edge of the parallel channel which is where downwards movement ended for the session.
At this stage I have two hourly wave counts. The point of differentiation, the confirmation / invalidation point, is close by. The main hourly wave count has a higher probability than the alternate.
Monthly charts can be seen here.
Click on the charts below to enlarge.
First Wave Count.
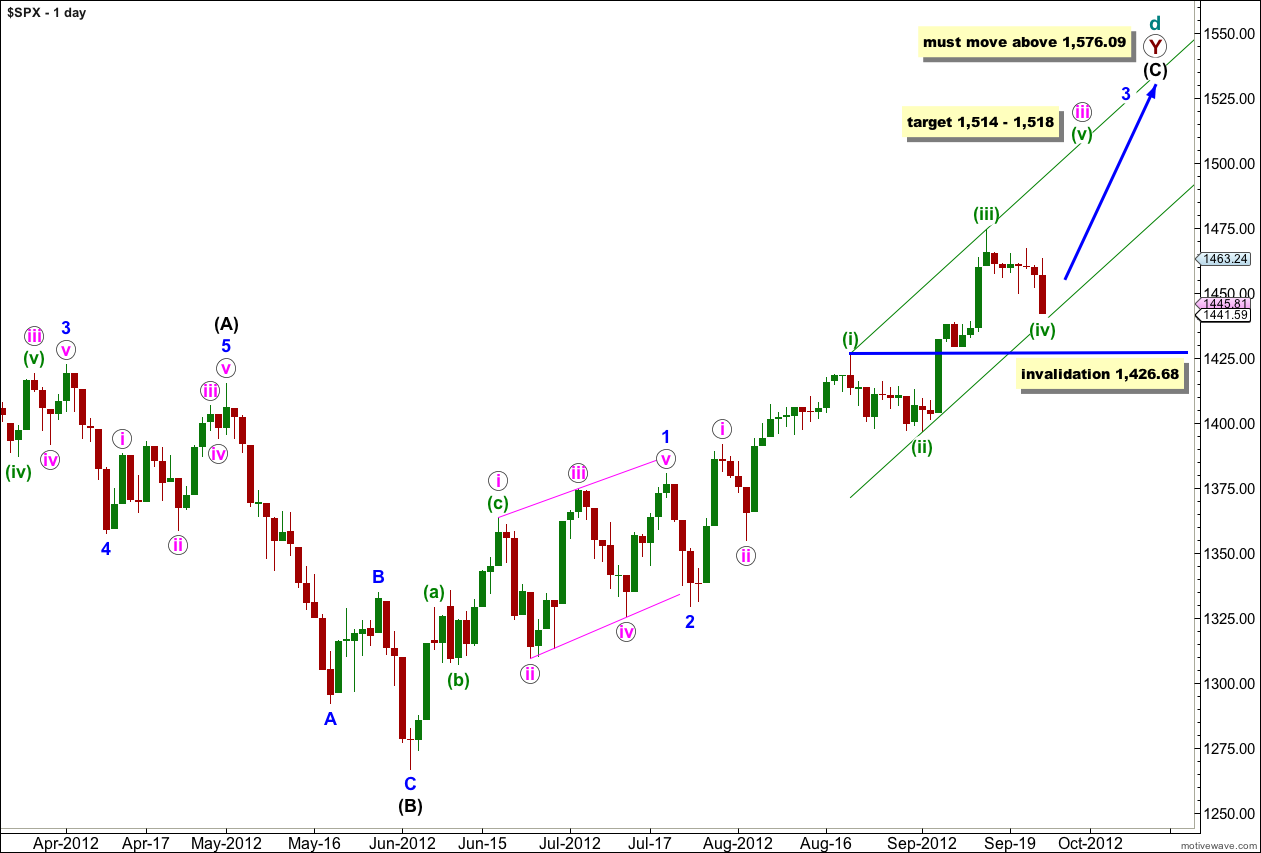
At super cycle degree this wave count sees a very rare expanding triangle unfolding, and cycle wave d upwards within the triangle is a double zigzag which must move beyond the end of cycle wave b.
Within the second zigzag of the double, primary wave Y, wave (C) black must unfold as a five wave structure.
Waves 1 and 2 blue are complete. At this stage wave 3 blue is unfolding upwards as an impulse. When wave 3 blue is complete then we shall expect downwards movement for wave 4 blue. It is at this point that this first wave count diverges from the second wave count: the first wave count will expect price to not move back into wave 1 blue price territory below 1,380.39 while the second wave count would expect movement below this point. At that stage the price point 1,380.39 will differentiate which wave count is correct.
Within wave 3 blue at 1,518 wave iii pink would reach 2.618 the length of wave i pink.
At 1,514 wave (v) green would reach equality with wave (i) green.
Any further downwards movement for wave (iv) green may not move into wave (i) green price territory. This wave count is invalidated with movement below 1,426.68.
Main Hourly Wave Count.
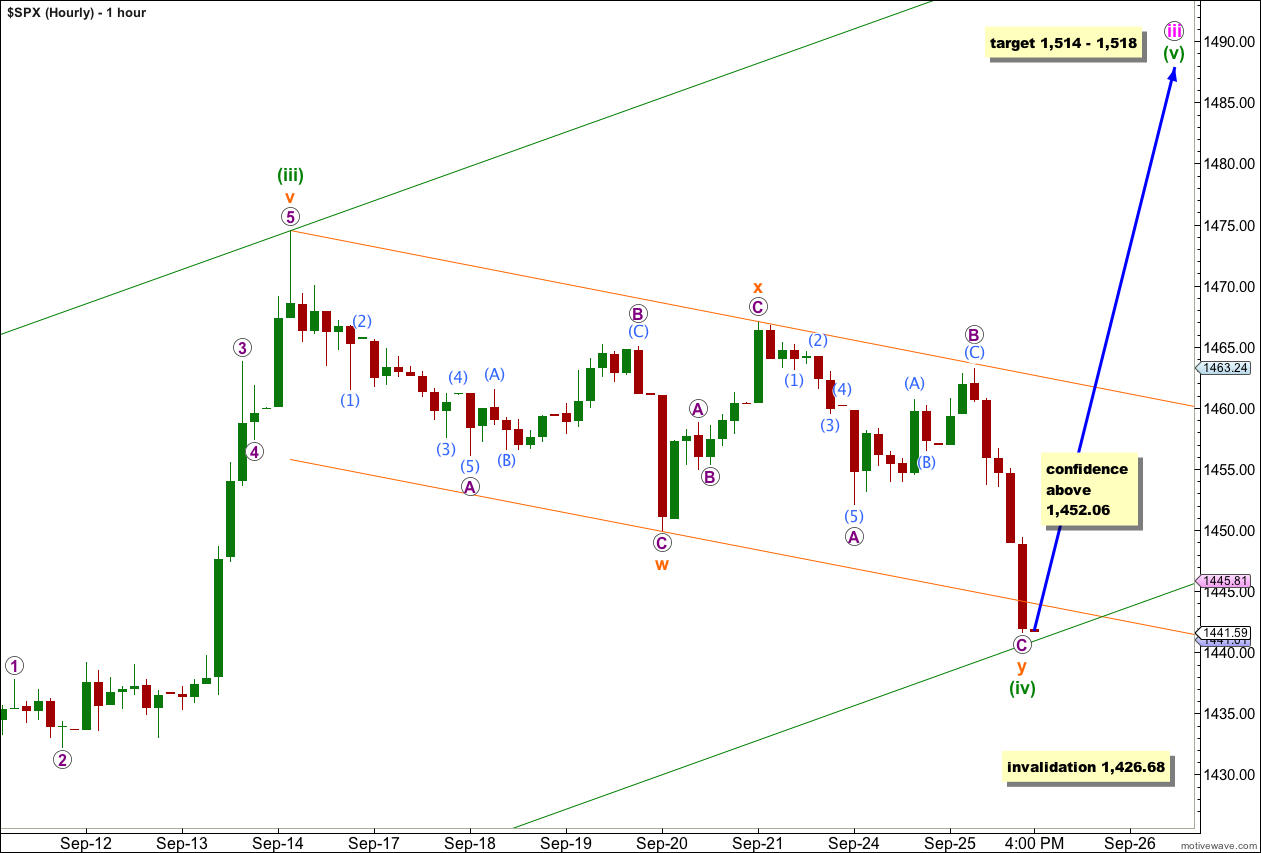
Because price did not move above 1,466 before moving lower to invalidate the first two hourly charts published yesterday, wave (iv) green cannot be a double combination because both these structures are zigzags.
Wave (iv) green is so far a double zigzag most likely. The purpose of double zigzags is to deepen a correction when the first zigzag is not deep enough, in contrast to the purpose of a double combination to move price sideways. In this instance the correction is deepened and this structure looks typical.
Within wave w orange there is no Fibonacci ratio between waves A and C purple. Within wave y orange there is no Fibonacci ratio between waves A and C purple.
Wave (iv) green may end here at the lower edge of the parallel channel, and this seems most likely. This would give it a typical look. However, there is not enough upwards movement at the end of Tuesday’s session to confirm that wave C purple is a complete five wave structure. It’s final fifth wave may continue a little lower. If it does then wave (iv) green may not move into wave (i) green price territory. This wave count is invalidated with movement below 1,426.68.
Movement above 1,452.06 tomorrow would provide some confidence for this wave count as at that stage the alternate below would be invalid.
Alternate Hourly Wave Count.
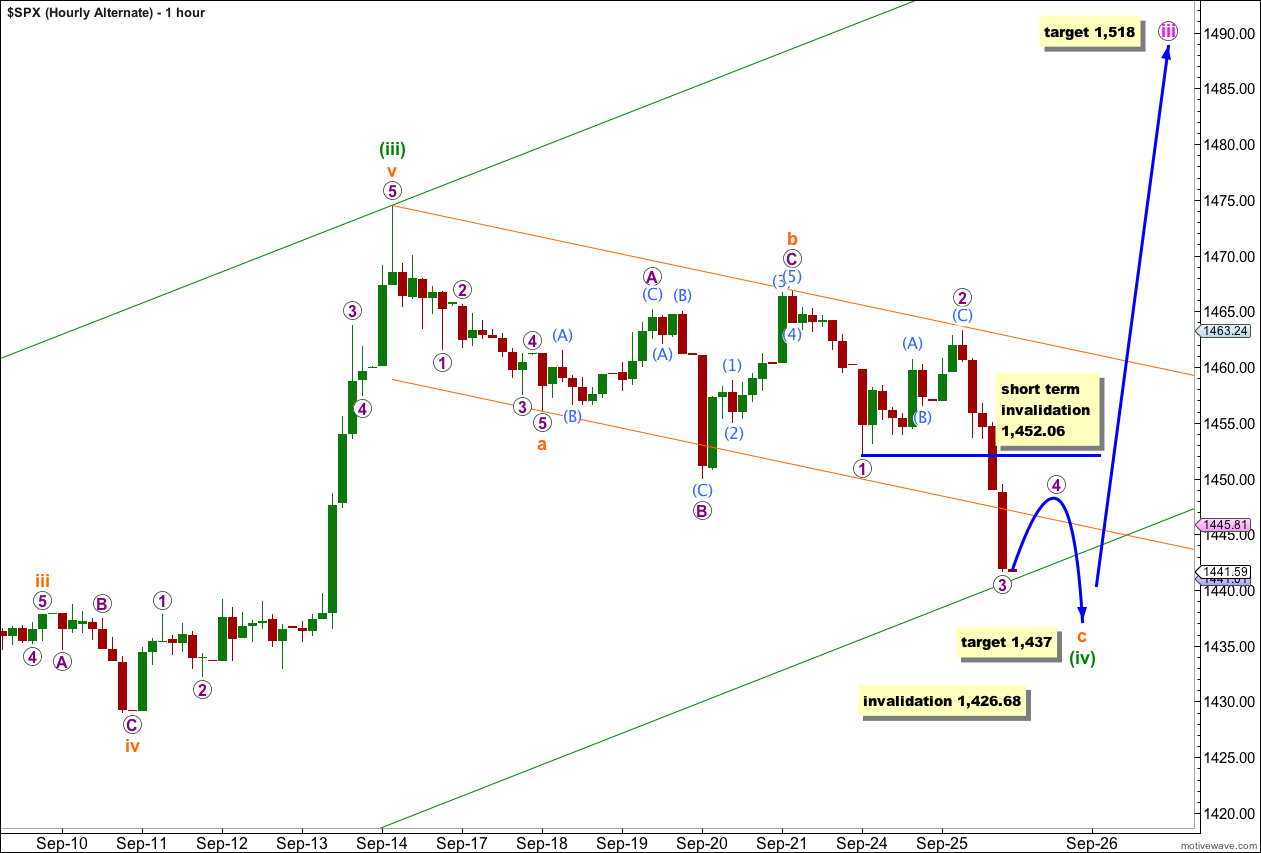
Alternately, wave (iv) green may not be over and may be unfolding as a single zigzag.
Wave c orange may be incomplete. Because the third wave labeled 3 purple has such a strong impulsive look it is unlikely that wave c orange is unfolding as an ending diagonal because that structure requires all subwaves to subdivide into zigzags. Wave c orange looks most like a simple impulse which is incomplete.
Wave 4 purple may not move into wave 1 purple price territory. This wave count is invalidated in the short term with movement above 1,452.06.
Wave c orange would reach 1.618 the length of wave a orange at 1,437. This would see wave (iv) green slightly overshoot the parallel channel.
Wave (iv) green may not move into wave (i) green price territory. This wave count is invalidated with movement below 1,426.68.
Second Wave Count.
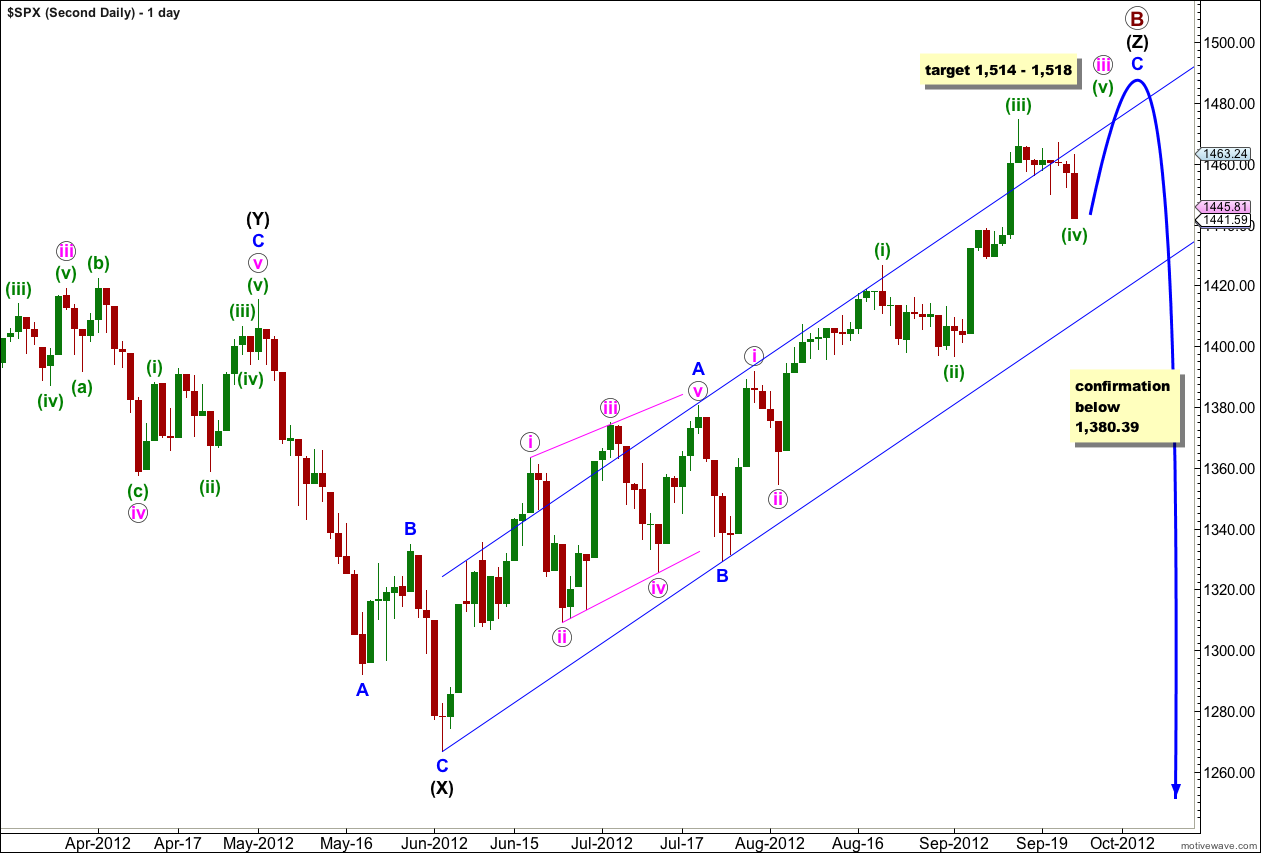
At grand super cycle degree this wave count sees a double flat correction unfolding, which is a common structure. The second flat in the double has begun. Within a flat the A wave must subdivide into a three wave structure, so here at cycle degree a three wave flat is unfolding. Within cycle wave a primary wave A is complete and primary wave B is incomplete.
After the last few days’ sideways movement it looks most likely that primary wave B is incomplete and needs a final fifth wave upwards.
At 1,513 wave C blue would reach 1.618 the length of wave A blue. Also at 1,513 wave v pink within C blue would reach 1.618 the length of wave iii pink. This target has a good probability.
Thereafter, movement below 1,380.39 would take price back into what is wave 1 blue price territory for the first monthly wave count, and that would tip the balance in favour of this second wave count.
At the hourly chart level at this stage both this second wave count and the first wave count are the same. The two hourly charts above will suffice for this wave count also.