
In line with the S&P 500 I am going to use what was our alternate monthly chart as a wave count equivalent to the main.
For the Dow I have now two wave counts which have different targets and mid term expectations, and have about an even probability.
This week’s analysis necessarily covers monthly charts because the two wave counts differ at cycle degree.
Click on the charts below to enlarge.
First Wave Count.
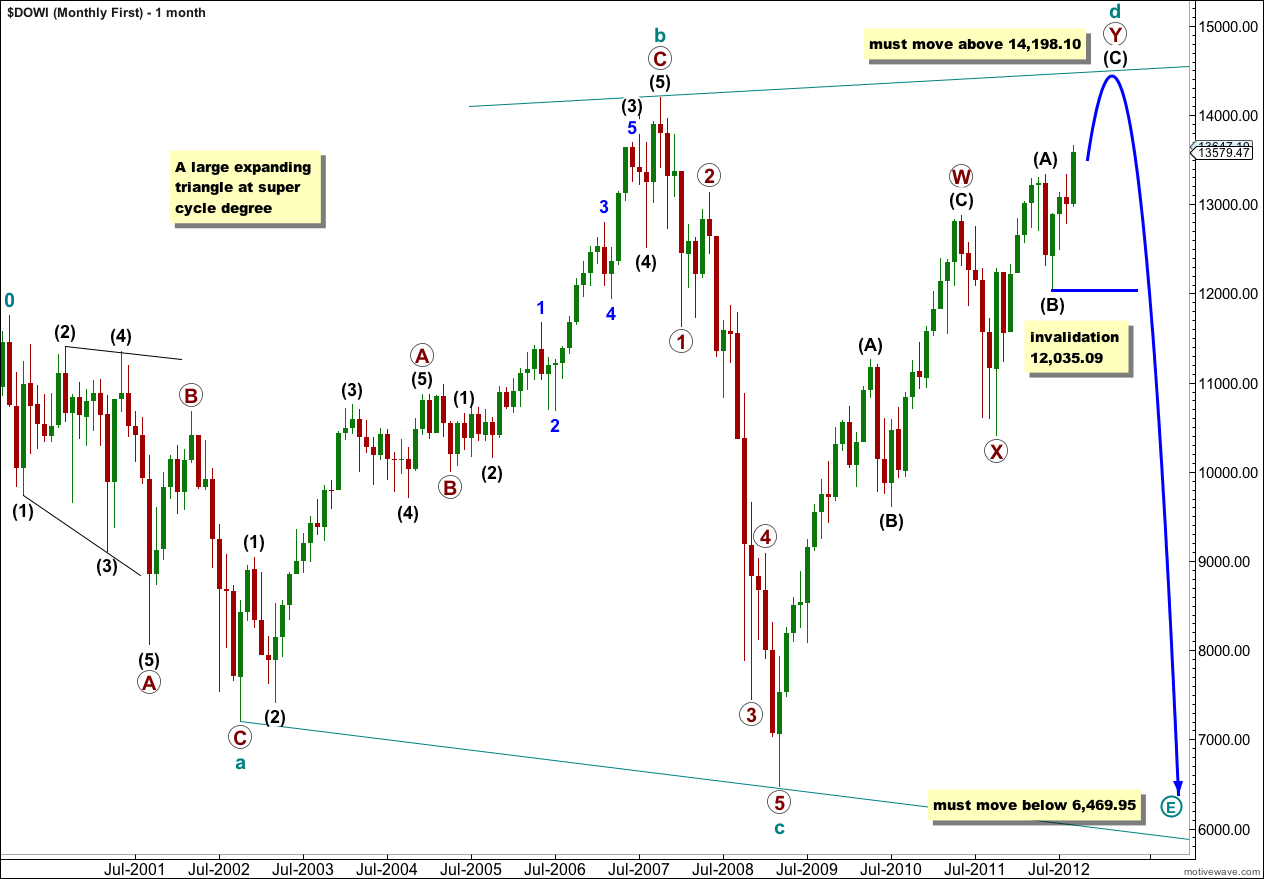
This first wave count looks at the possibility that the Dow is in a very large expanding triangle unfolding at super cycle degree. However, expanding triangles are the rarest of all Elliott wave structures.
Four of the five subwaves of a triangle must be zigzags or zigzag combinations (doubles). Thus cycle wave c may be an impulse.
Within a triangle one of the five subwaves should be more complicated and longer lasting than the others. This is usually wave c of the triangle, but in this instance it may be cycle wave d which is subdividing into a double zigzag.
Within cycle wave d the first zigzag in the double, primary wave W, is complete. The double is joined by a three in the opposite direction labeled primary wave X. The second zigzag in the double is underway labeled primary wave Y.
An expanding triangle requires cycle wave d to move beyond the end of cycle wave b above 14,198.10.
Within primary wave Y intermediate (black) wave (A) must be seen as a five wave structure.
Within intermediate wave (C) wave 2 may not move beyond the start of wave 1. This wave count is invalidated in the mid term with movement below 12,035.09.
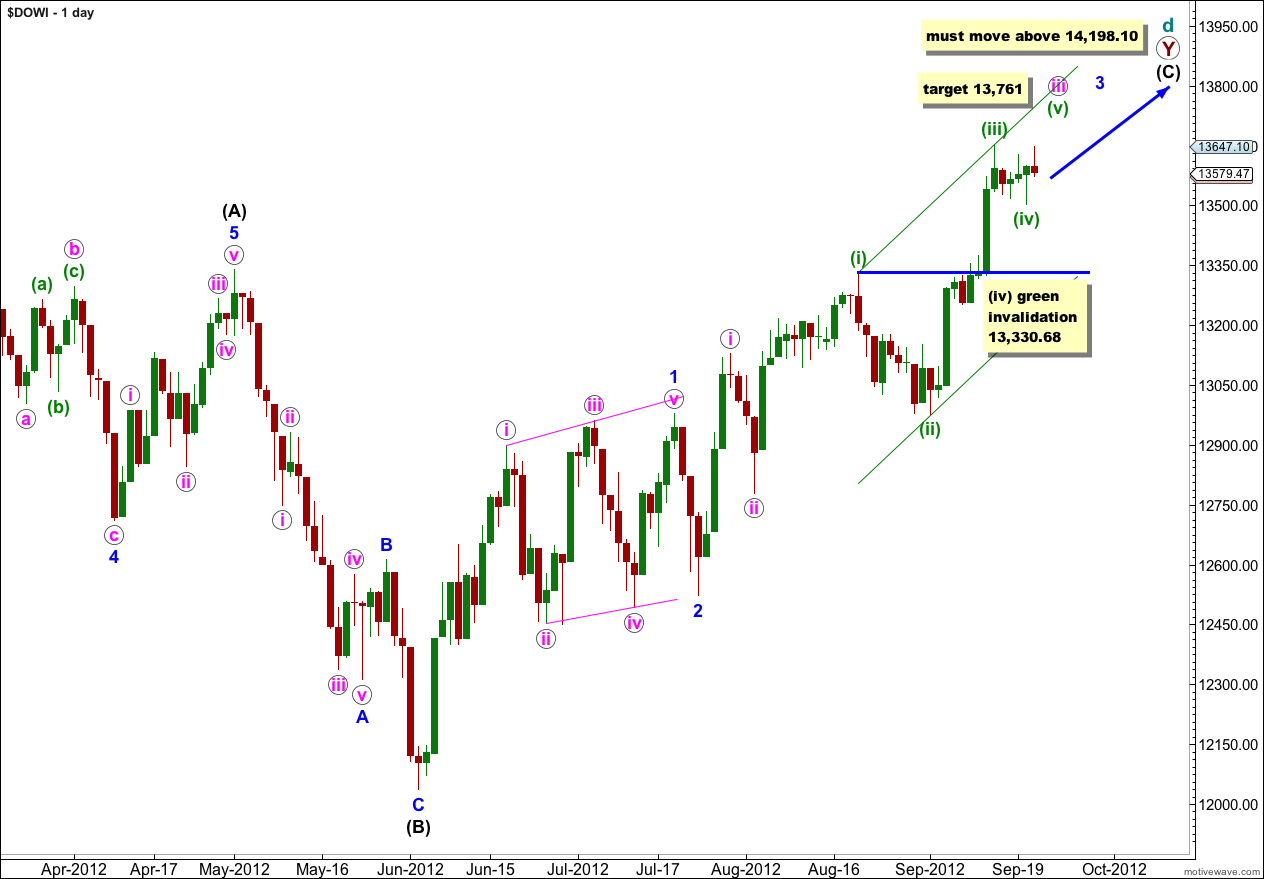
The daily chart shows the subdivisions of wave (C) black which must subdivide into a five wave structure. It is subdividing as an impulse.
Within wave (C) black wave 3 blue is incomplete.
Within wave 3 blue wave iii pink is incomplete.
At 13,761 wave iii pink would reach 1.618 the length of wave i pink. Also at 13,761 wave (v) green within wave iii pink would reach 0.382 the length of wave (iii) green. This target has a good probability.
If wave (iv) green is incomplete and moves price sideways and lower for a few more sessions then it may not move into wave (i) green price territory. This wave count is invalidated with movement below 13,330.68
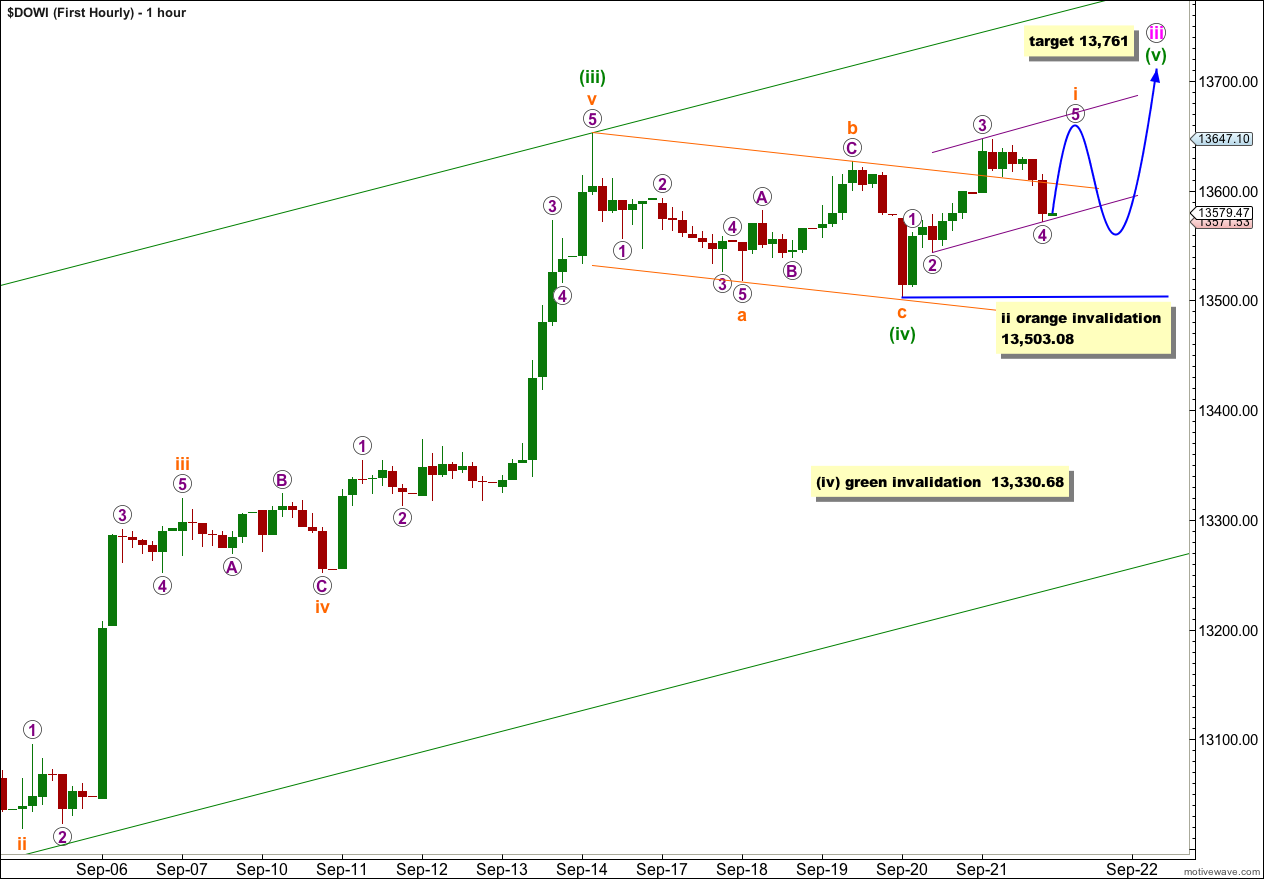
Within wave iii pink wave (iv) green may have ended and taken up most of last week.
Wave (iv) green as a single shallow zigzag exhibits alternation with wave (ii) green as a deep triple zigzag.
Within wave (v) green the first wave for i orange is incomplete. When it is then we should expect a second wave correction for ii orange which may not move beyond the start of wave i orange below 13,503.08.
Second Wave Count.
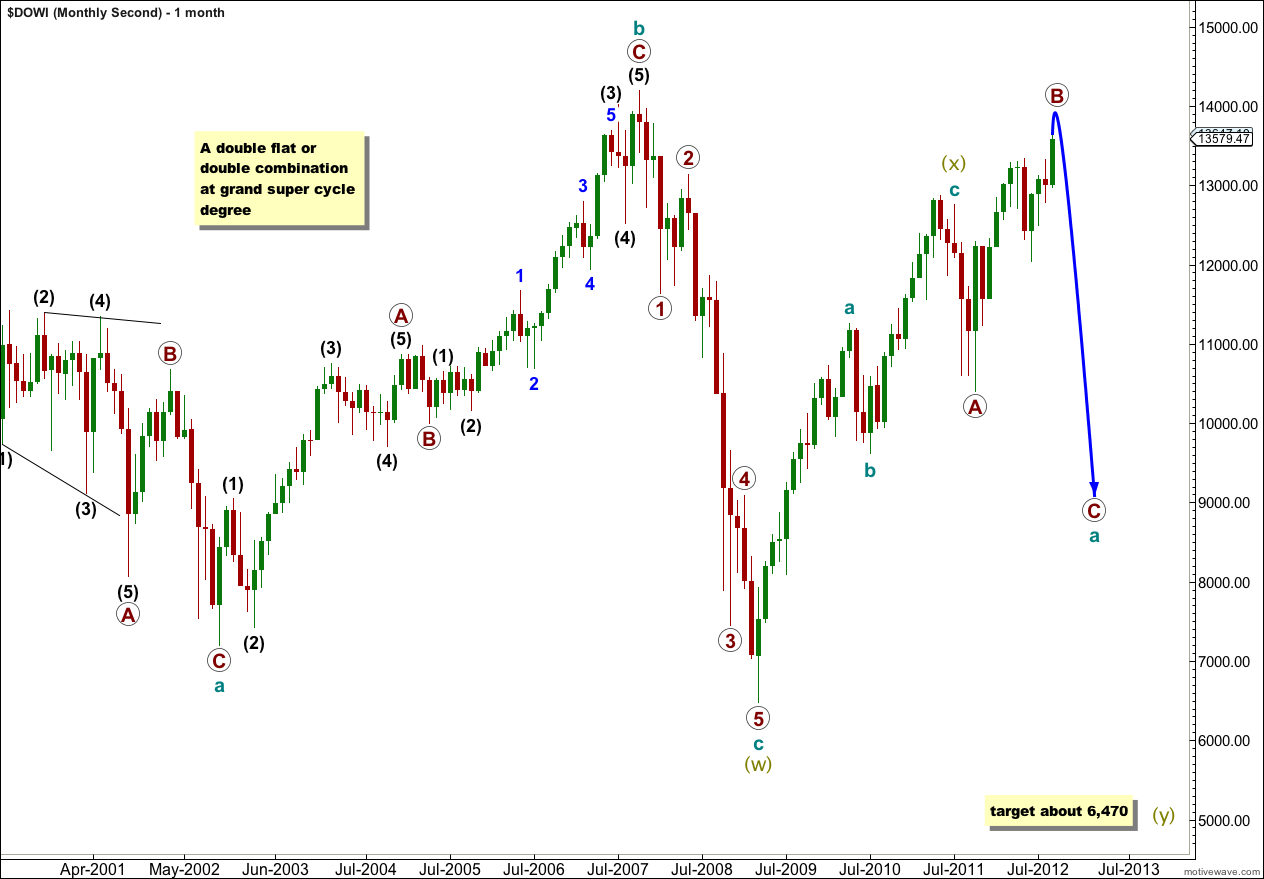
This second wave count looks at the possibility that the Dow is within a very large double flat or double combination correction at grand super cycle degree.
The first structure in the double is an expanded flat correction at super cycle degree labeled (w) olive green. Within wave super cycle wave (w) cycle wave b (teal green) is a 154% correction of cycle wave a, and cycle wave c has no Fibonacci ratio to cycle wave a.
The double is joined by a three in the opposite direction labeled super cycle (x).
The second structure in the double has begun, labeled super cycle wave (y). Super cycle wave (y) may be either a flat correction or a triangle.
Within super cycle wave (y) cycle wave a is subdividing into a three, an expanded flat correction. Primary wave A within it was a three, primary wave B is incomplete. Primary wave B has just passed the maximum common length for a B wave in relation to an A wave for a flat correction at 13,647. This reduces the probability of this wave count and is my primary reason for expecting it now has about an equal probability with the first monthly wave count.
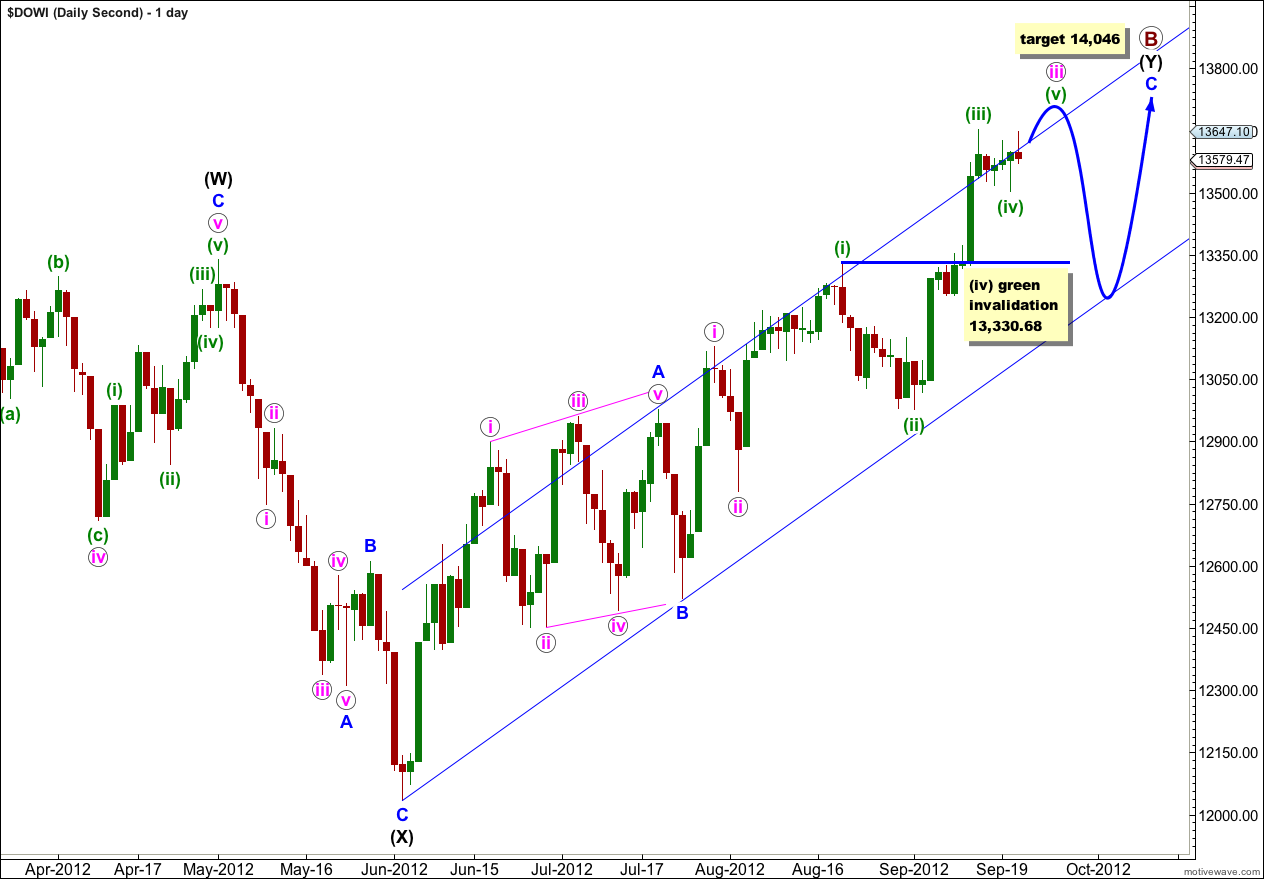
At the daily chart level this wave count has the same short and mid term expectation as the first wave count. It expects more upwards movement for the completion of a third wave. Thereafter, a fourth wave correction and for this wave count a final fifth wave upwards. Thereafter, the wave counts diverge and at that stage I will use an invalidation / confirmation point to differentiate between the two.
Wave C blue has already passed equality in length with wave A blue. The next target is at 14,046 where wave C blue would reach 1.618 the length of wave A blue.
Wave (iv) green may be over or it may continue further sideways for another week. If it does continue it may not move into wave (i) green price territory. This wave count is invalidated with movement below 13,330.68.
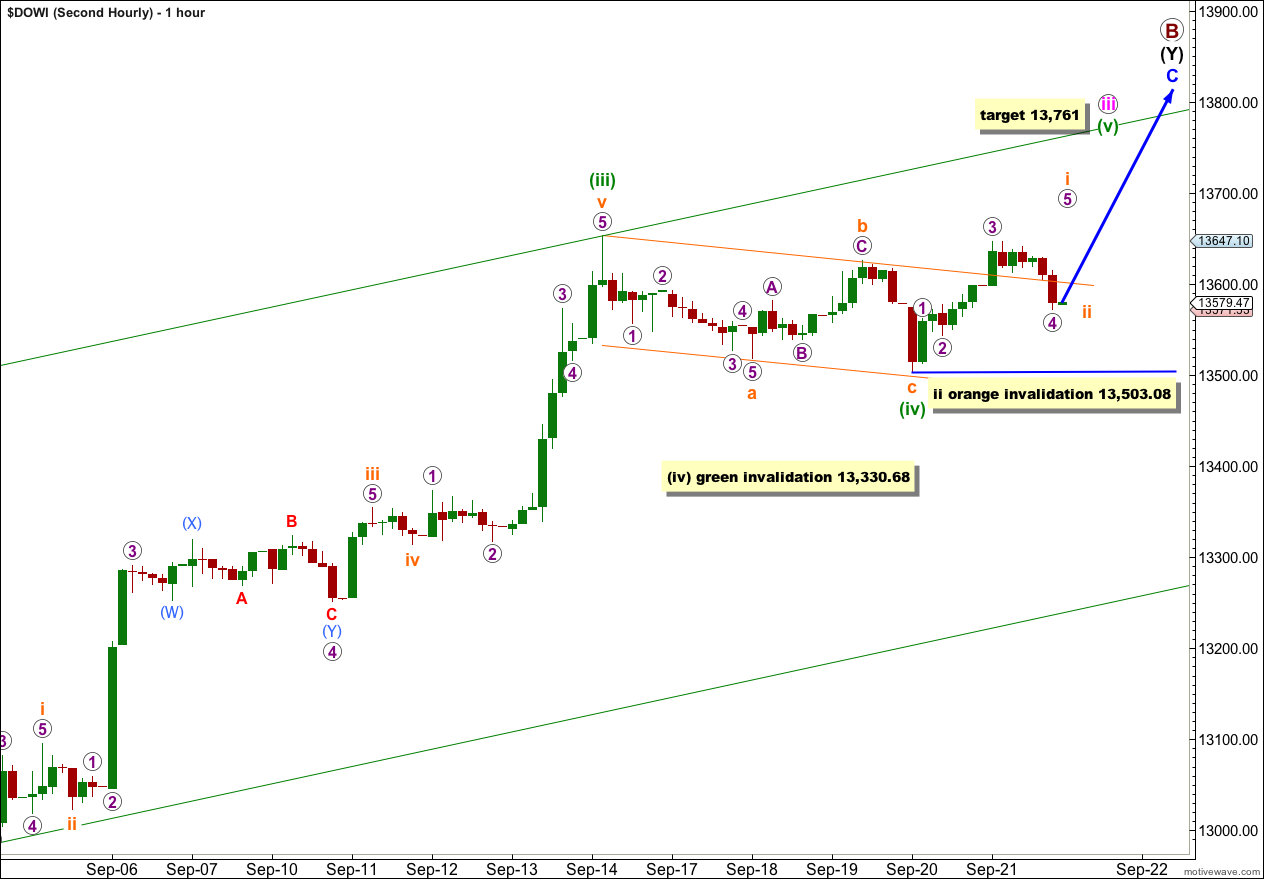
At the hourly chart level at this stage this wave count is the same as the first wave count. The target is the same and the invalidation point is the same.
At 13,761 wave iii pink would reach 1.618 the length of wave i pink. Also at 13,761 wave (v) green within wave iii pink would reach 0.382 the length of wave (iii) green. This target has a good probability.