
Analysis of price action for Thursday’s session expected the S&P 500 to move higher during Friday which is what happened at the beginning of Friday’s session. Price then ended close to the open; a mostly sideways day.
I have the same two wave counts which still have about an even probability. They differ at cycle degree and you can see the monthly charts here.
At this stage the two wave counts again diverge in their expectation of direction for Monday’s session.
Click on the charts below to enlarge.
First Wave Count.
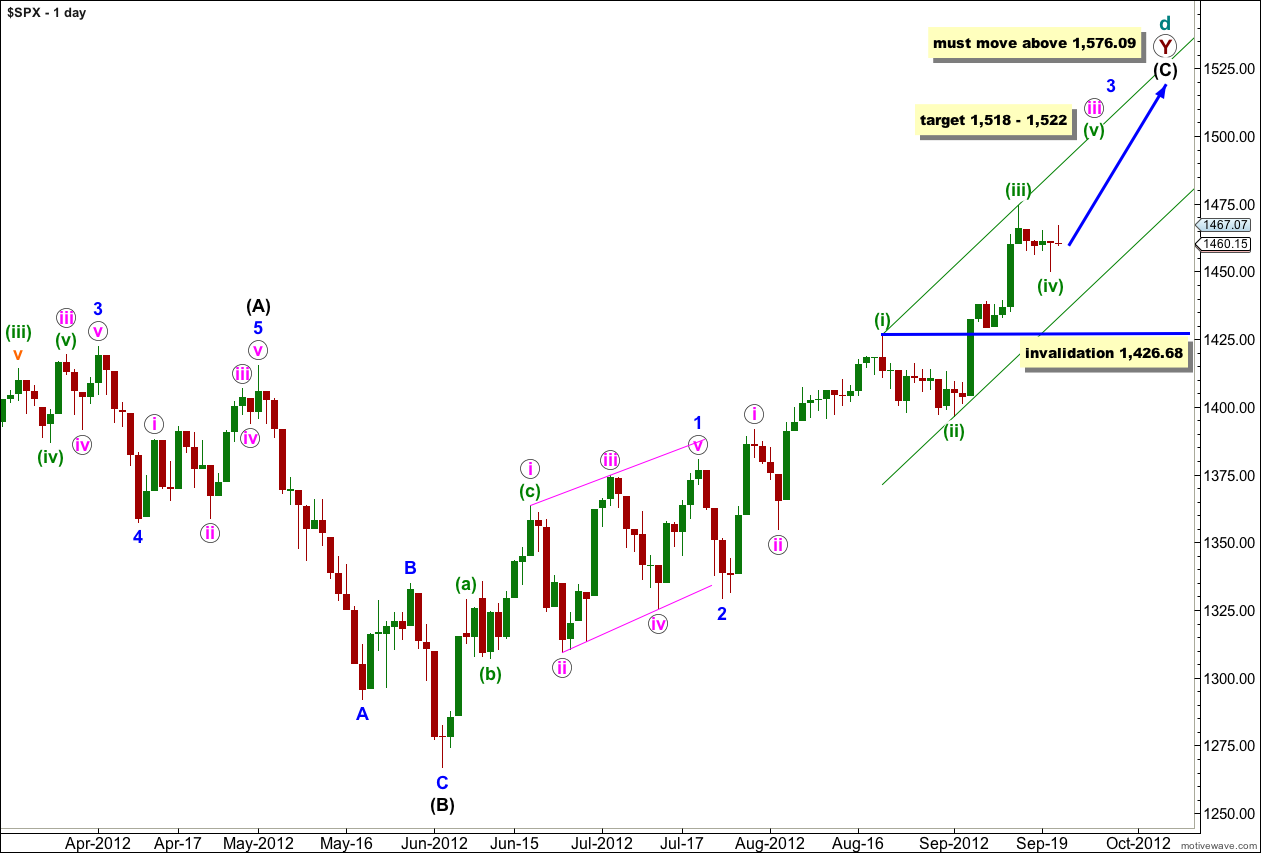
At super cycle degree this wave count sees a very rare expanding triangle unfolding, and cycle wave d upwards within the triangle is a double zigzag which must move beyond the end of cycle wave b.
Within the second zigzag of the double, primary wave Y, wave (C) black must unfold as a five wave structure.
Waves 1 and 2 blue are complete. At this stage wave 3 blue is unfolding upwards as an impulse.
Within wave 3 blue at 1,518 wave iii pink would reach 2.618 the length of wave i pink.
At 1,522 wave (v) green would reach equality with wave (i) green.
Any further downwards movement for wave (iv) green may not move into wave (i) green price territory. This wave count is invalidated with movement below 1,426.68.
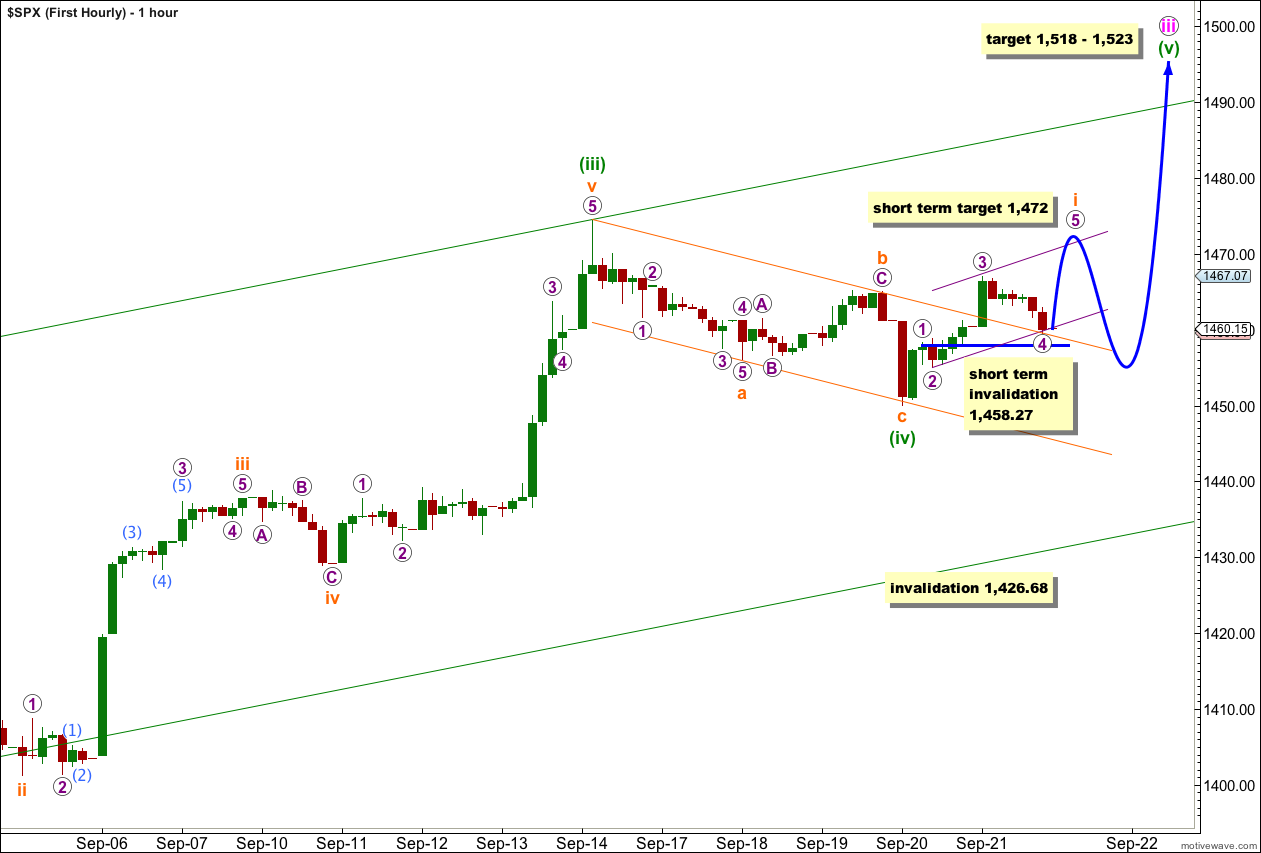
The small parallel channel drawn about wave (iv) green was breached early during Friday’s session indicating that the downwards zigzag was over and an upwards movement was underway. At this stage the upwards movement is an incomplete impulse.
Within wave (v) green wave i orange would be incomplete. Within wave i orange waves 1 through to 4 purple would be complete. When markets open on Monday morning any further downwards movement for wave 4 purple may not move into wave 1 purple price territory. This wave count is invalidated in the short term with movement below 1,458.27.
At 1,472 wave 5 purple would reach equality in length with wave 3 purple. However, this target does not have a high probability because there already exists a good Fiboancci ratio between waves 1 and 3 purple: wave 3 purple is just 0.36 points short of 1.618 the length of wave 1 purple.
Wave 5 purple may end about the upper edge of the very small purple channel drawn about wave i orange.
When wave i orange is complete wave ii orange should move price lower. Wave ii orange may not move beyond the start of wave i orange. At that stage the short term invalidation point would lie at 1,450.68.
If price moves below 1,450.68 then wave (iv) green would be incomplete and would be moving price sideways and a little lower. If this is the case we could expect a few more sessions of overall sideways movement.
Wave (iv) green may not move into wave (i) green price territory. This wave count is invalidated with movement below 1,426.68.
Second Wave Count.
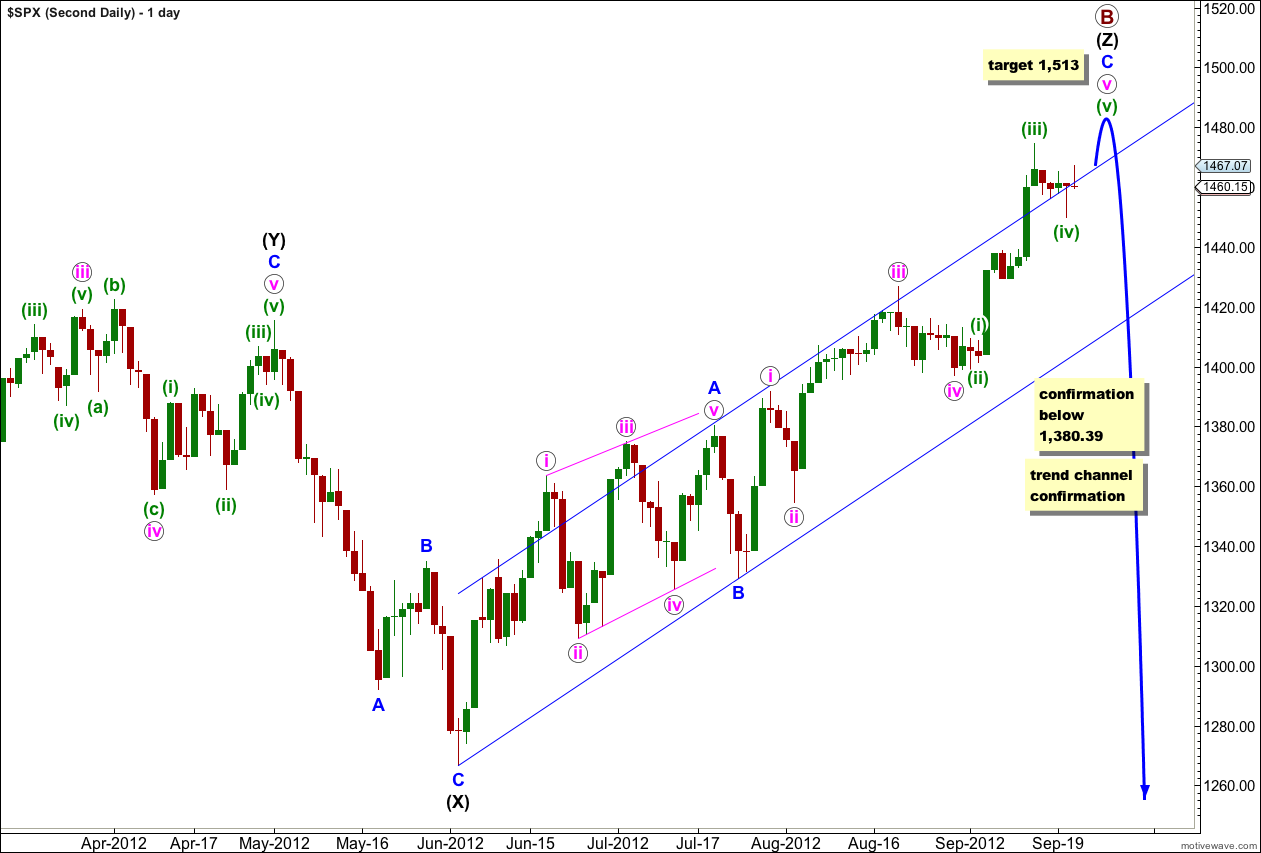
At grand super cycle degree this wave count sees a double flat correction unfolding, which is a common structure. The second flat in the double has begun. Within a flat the A wave must subdivide into a three wave structure, so here at cycle degree a three wave flat is unfolding. Within cycle wave a primary wave A is complete and primary wave B is incomplete.
After the last few days’ sideways movement it looks most likely that primary wave B is incomplete and needs a final fifth wave upwards.
At 1,513 wave C blue would reach 1.618 the length of wave A blue. Also at 1,513 wave v pink within C blue would reach 1.618 the length of wave i pink. This target has a good probability.
Thereafter, movement below 1,380.39 would take price back into what is wave 1 blue price territory for the first monthly wave count, and that would tip the balance in favour of this second wave count.
This wave count agrees with MACD as it sees the strongest upwards movement as the third wave, labeled (iii) green, within this fifth wave of v pink.
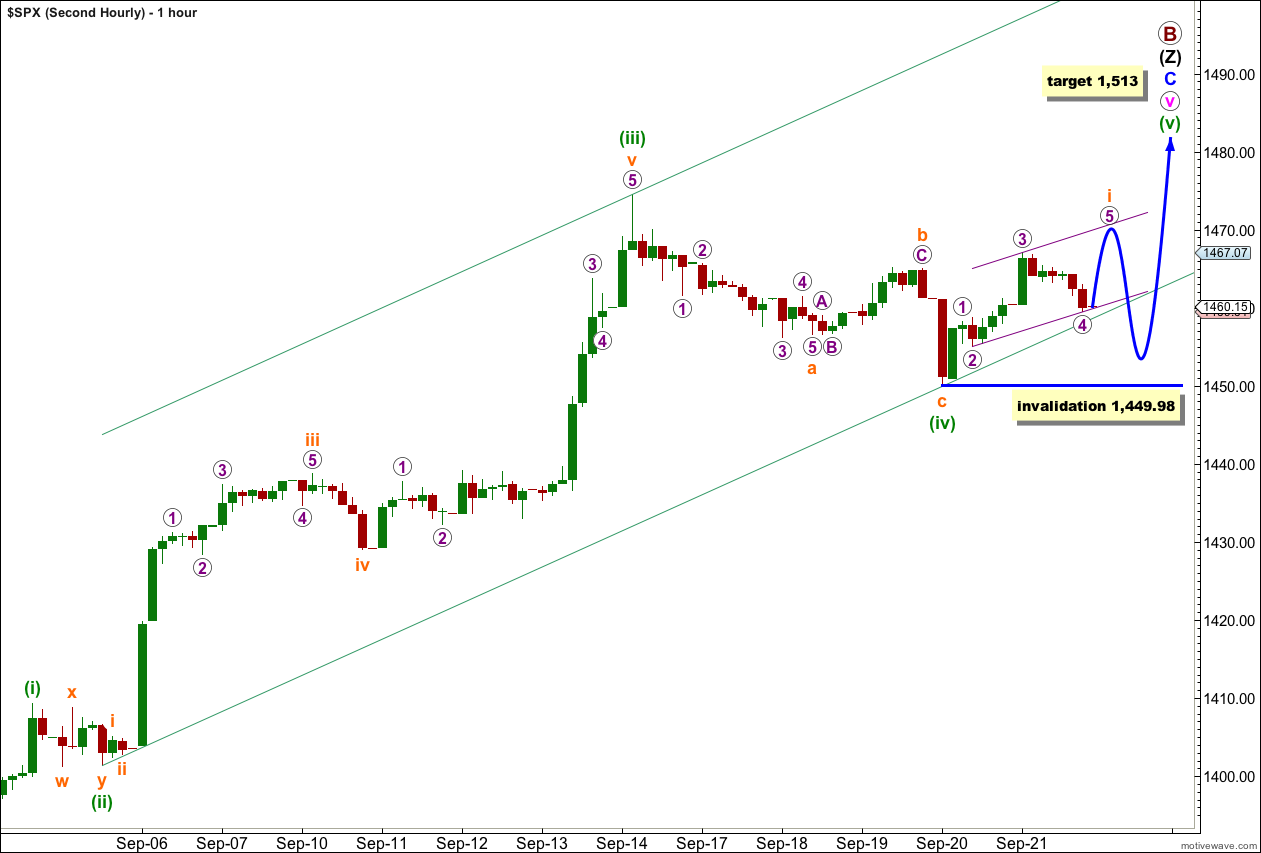
I am reverting to this labeling on the hourly chart for this wave count because price moved above 1,465.01 during Friday’s session invalidating my last labeling. This upwards movement cannot be a second wave correction and it would be unlikely to be a C wave up of a correction because the subdivisions just don’t fit.
Within the final upwards wave of (v) green wave i orange is incomplete. At wave degrees minuette (green) and below this wave count is essentially the same on the hourly chart as the first wave count. The target differs.
Wave ii orange may not move below the start of wave i orange. This wave count is invalidated with movement below 1,449.98.