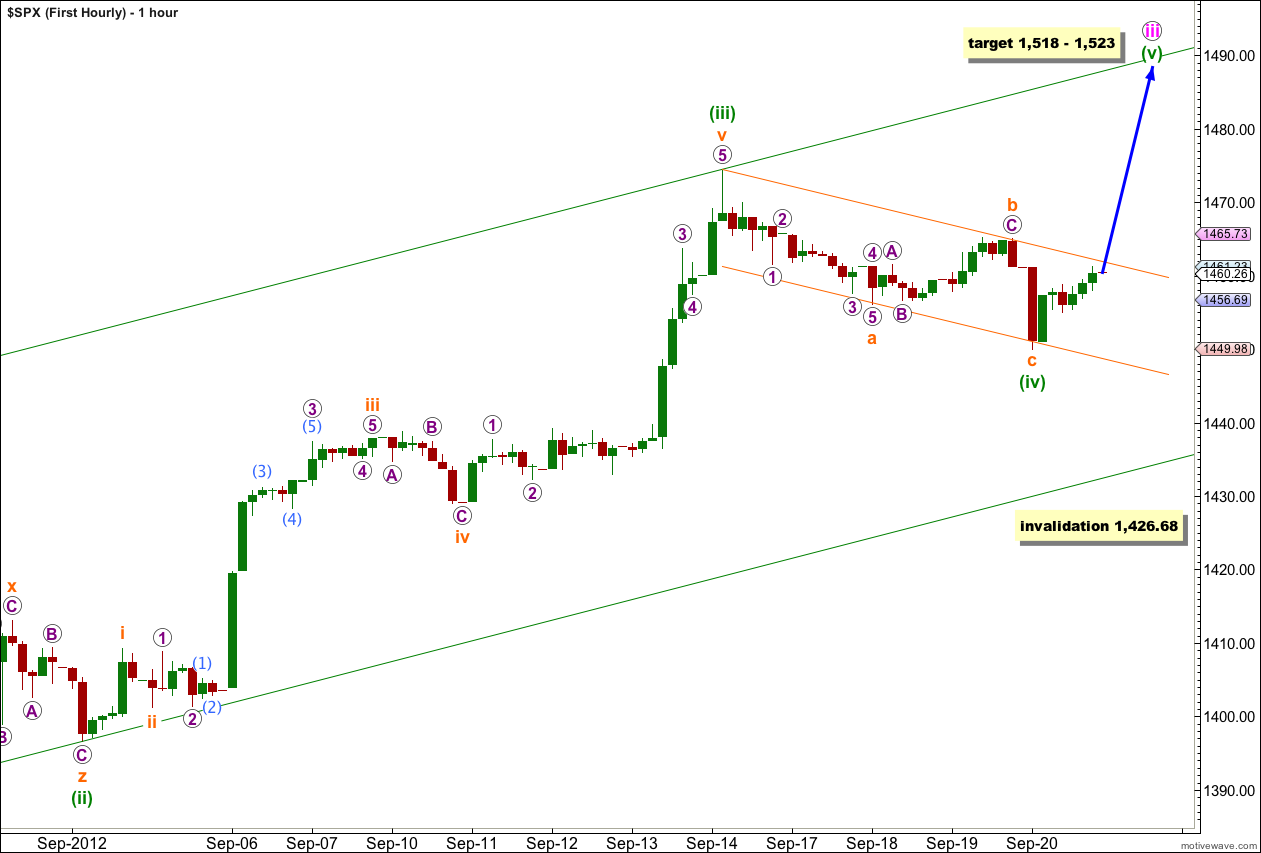
Last analysis expected the S&P 500 to move lower during Thursday’s session towards a short term target at 1,447. Price has moved lower as expected reaching 3.58 points short of the target and ending exactly on the lower edge of the parallel channel on the hourly chart.
I have the same two wave counts which still have about an even probability. They differ at cycle degree and you can see the monthly charts here.
At this stage the two wave counts diverge in their expectation of direction for tomorrow’s session.
Click on the charts below to enlarge.
First Wave Count.
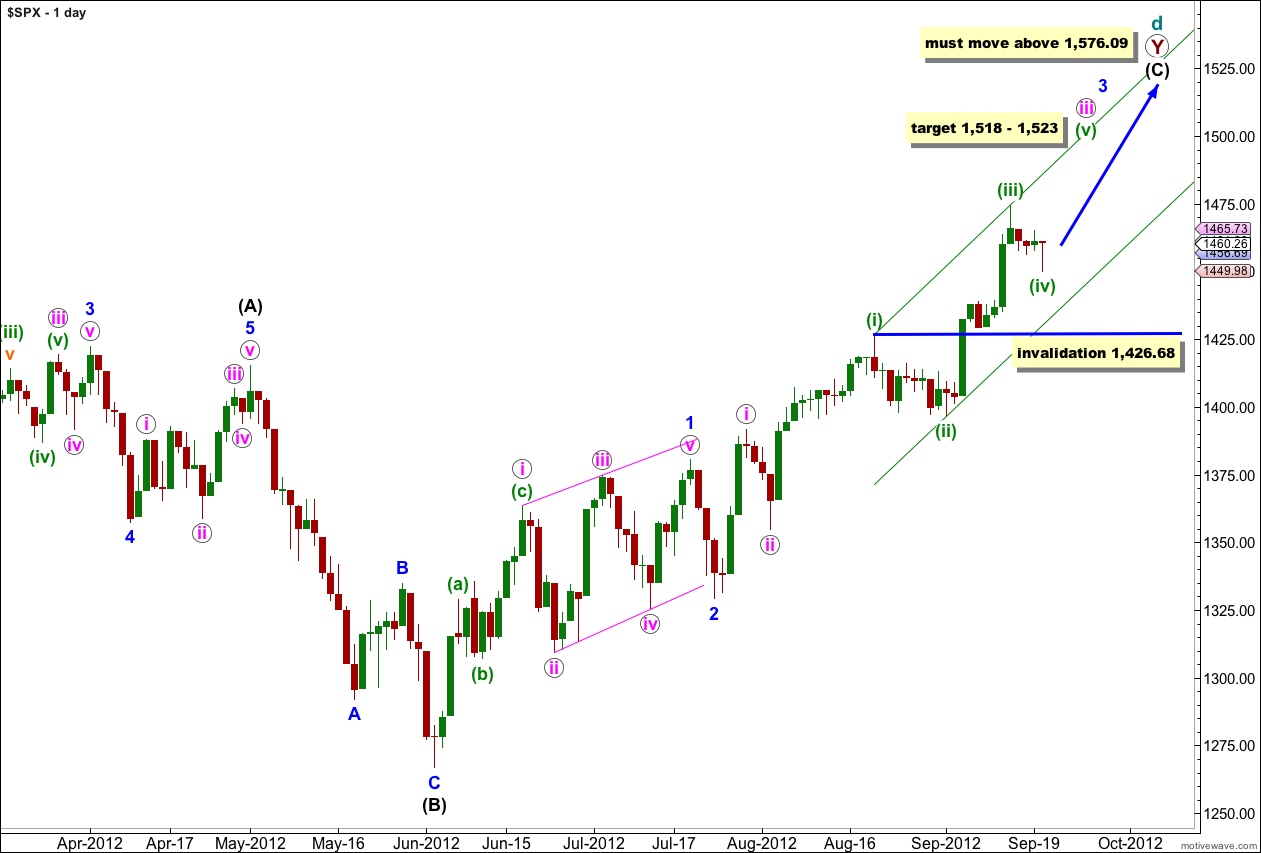
At super cycle degree this wave count sees a very rare expanding triangle unfolding, and cycle wave d upwards within the triangle is a double zigzag which must move beyond the end of cycle wave b.
Within the second zigzag of the double, primary wave Y, wave (C) black must unfold as a five wave structure.
Waves 1 and 2 blue are complete. At this stage wave 3 blue is unfolding upwards as an impulse.
Within wave 3 blue at 1,518 wave iii pink would reach 2.618 the length of wave i pink.
Any further downwards movement for wave (iv) green may not move into wave (i) green price territory. This wave count is invalidated with movement below 1,426.68.
Wave (iv) green may now be seen as a complete zigzag structure. Wave c orange has no Fibonacci ratio to wave a orange.
On the 5 minute chart wave c orange subdivides into a perfect impulse.
Wave c orange has ended with a very small overshoot of the small parallel channel drawn here about wave (iv) green using Elliott’s technique. When this channel is breached by clear upwards movement we shall have some indication that wave (v) green is underway.
Wave (ii) green lasted 9 sessions. Wave (iv) green so far has lasted 4 sessions. It may be over here. If it continues further it may take another 5 sessions.
Alternately, if we move the degree of labeling within wave (iv) green all down one degree this may have been only wave a orange of a flat correction for wave (iv) green. If price moves below 1,449.98 then clearly wave (iv) green would be continuing further sideways and a little lower.
If wave (iv) green moves lower it may not move into wave (i) green price territory. This wave count is invalidated with movement below 1,426.68.
Second Wave Count.
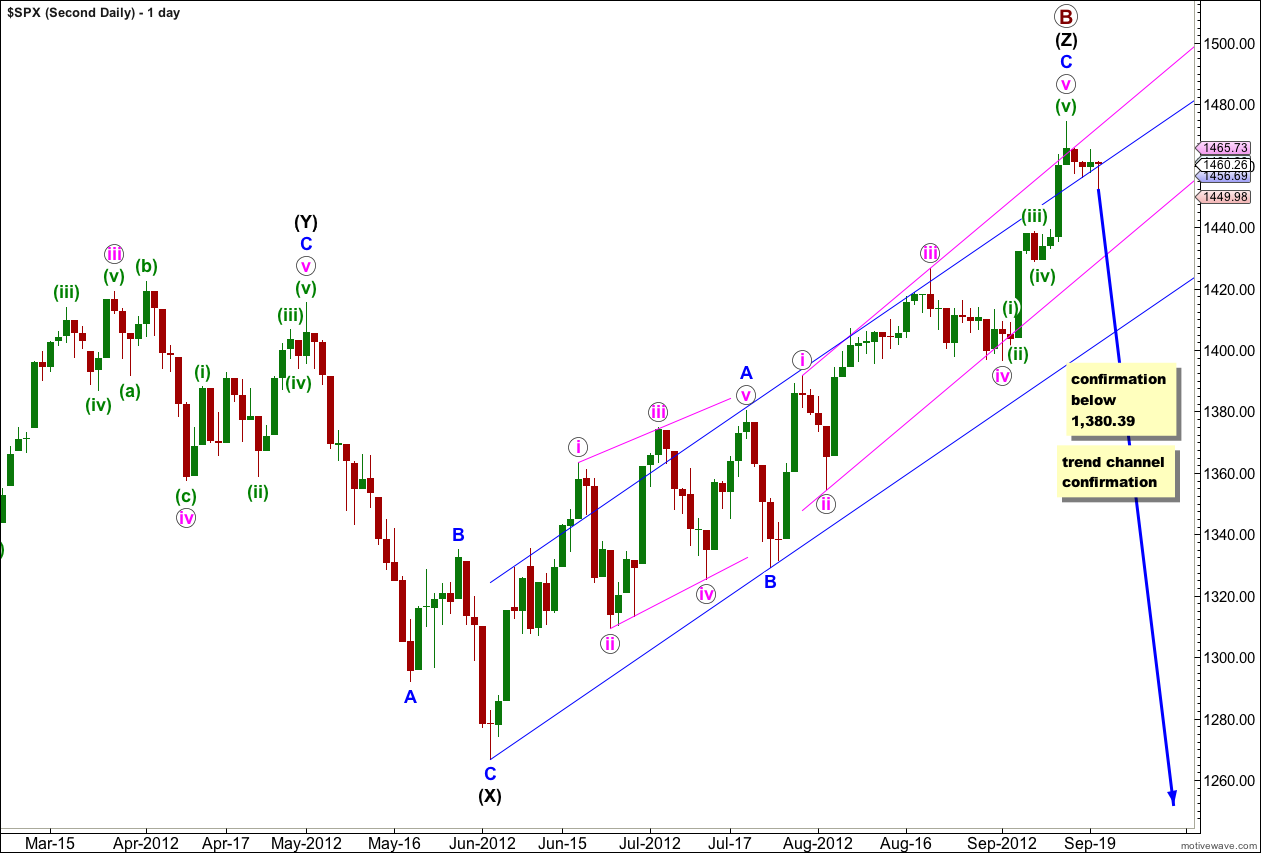
At grand super cycle degree this wave count sees a double flat correction unfolding, which is a common structure. The second flat in the double has begun. Within a flat the A wave must subdivide into a three wave structure, so here at cycle degree a three wave flat is unfolding. Within cycle wave a primary waves A and B are complete and now primary wave C down may have just begun.
If we use the same labeling for subdivisions within wave v pink as the first wave count is using then it is possible again that we may have seen an end to upwards movement. Alternatively, we can use the labeling that I used a few days ago which agrees with MACD and expects more upwards movement to 1,513 before a trend change.
If primary wave B is finally over we have absolutely no confirmation of this yet.
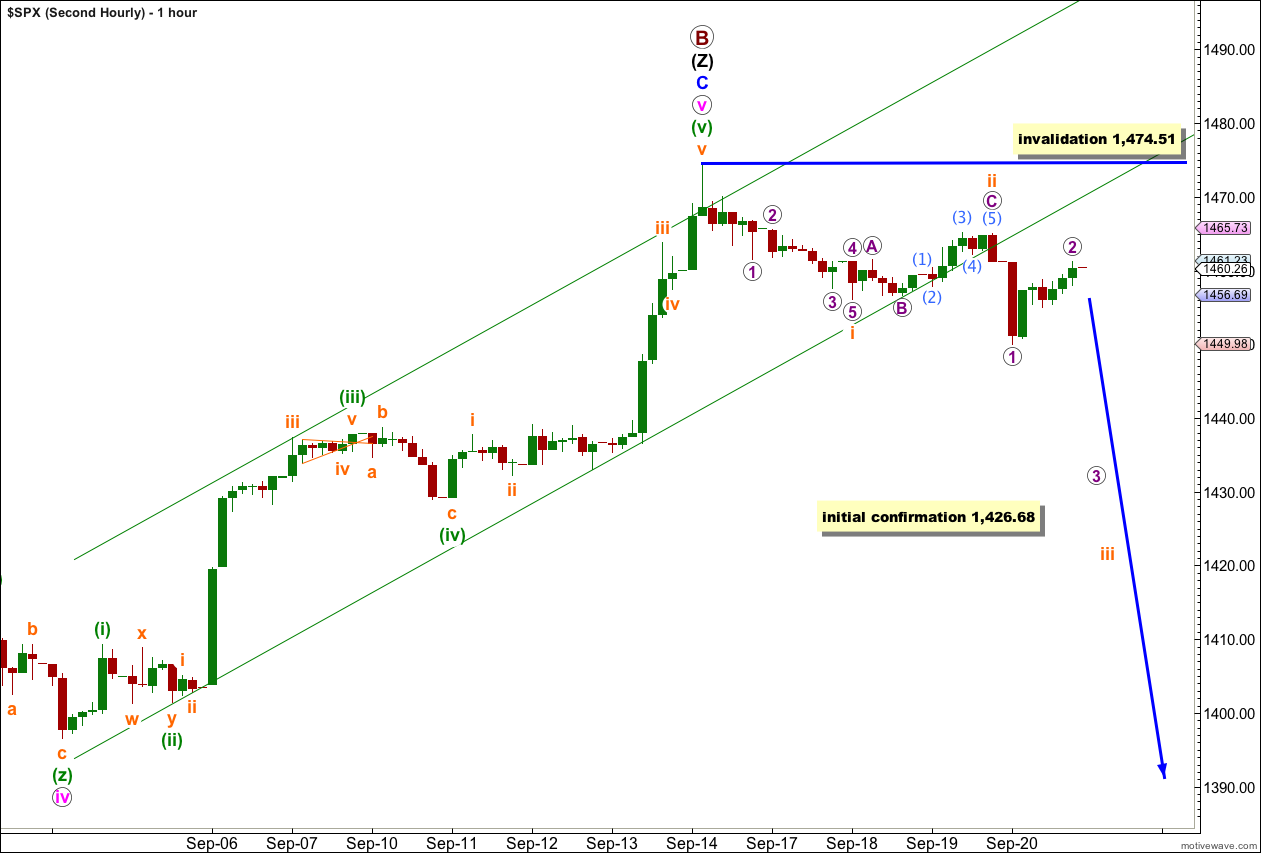
Movement initially below the parallel channel on the hourly chart would be required. Thereafter, movement below 1,426.68 would provide a little confidence in a possible trend change.
Movement below 1,380.39 would take price back into what is wave 1 blue price territory for the first monthly wave count, and that would tip the balance in favour of this second wave count.
At this stage downwards movement may be seen as two overlapping first and second wave movements, which has exactly the same subdivisions as A-B-C in that it subdivides into 5-3-5.
If this second wave count is correct then we should see an increase in downwards momentum during Friday’s session. Movement below 1,449.98 would be expected tomorrow for this wave count.
Any movement above 1,474.51 would invalidate this labeling on the hourly chart. At that stage I would revert to prior labeling which saw downwards movement as wave (iv) green and which had a target of 1,513 for the final upwards fifth wave of (v) green to complete primary wave B.


