
Sideways and slightly higher movement for Wednesday’s session looks like more corrective movement.
The wave counts both remain valid and targets are the same.
I have two wave counts which have about an even probability. They differ also at the monthly chart level which can be reviewed here.
Click on the charts below to enlarge.
First Wave Count.
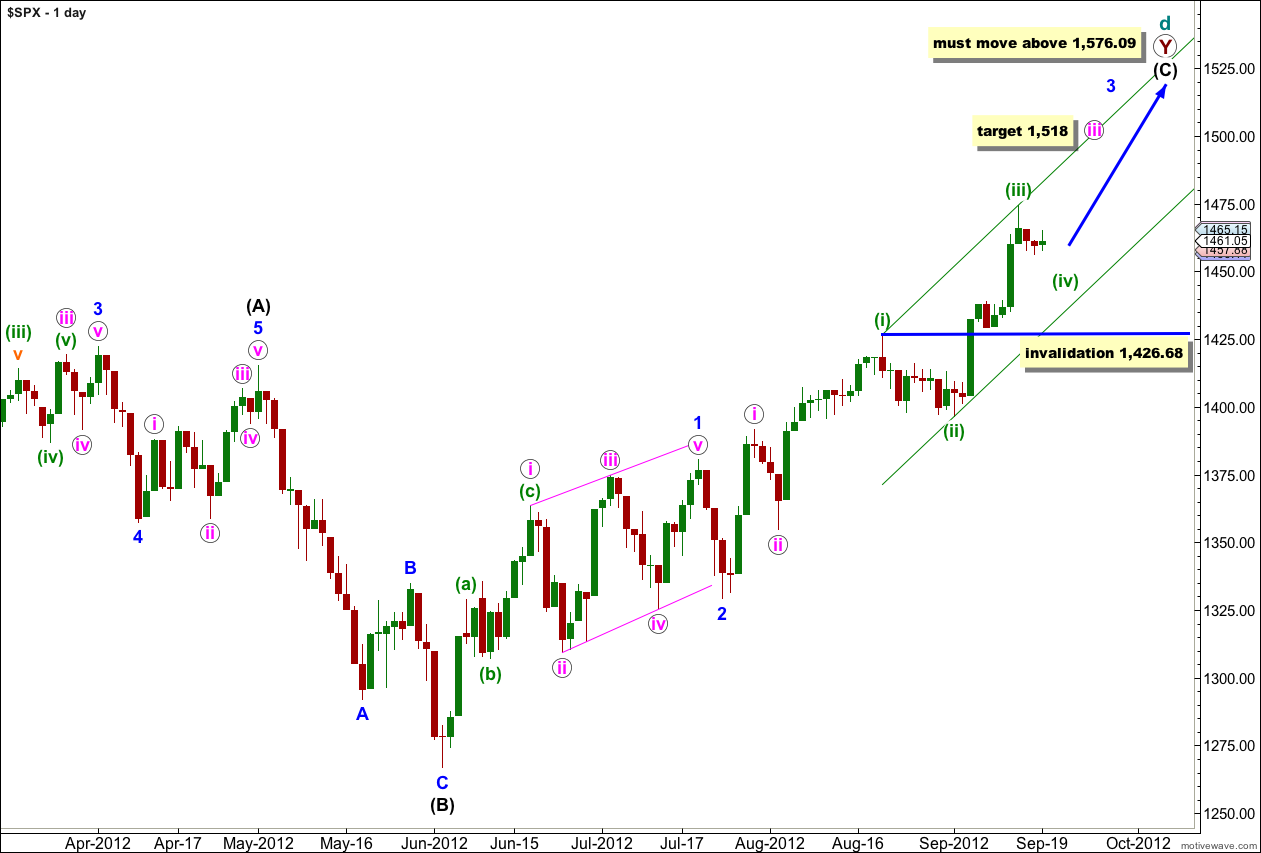
Wave (C) black must unfold as a five wave structure.
Waves 1 and 2 blue are complete. At this stage wave 3 blue is unfolding upwards as an impulse.
Within wave 3 blue at 1,518 wave iii pink would reach 2.618 the length of wave i pink.
Any further downwards movement for wave (iv) green may not move into wave (i) green price territory. This wave count is invalidated with movement below 1,426.68.
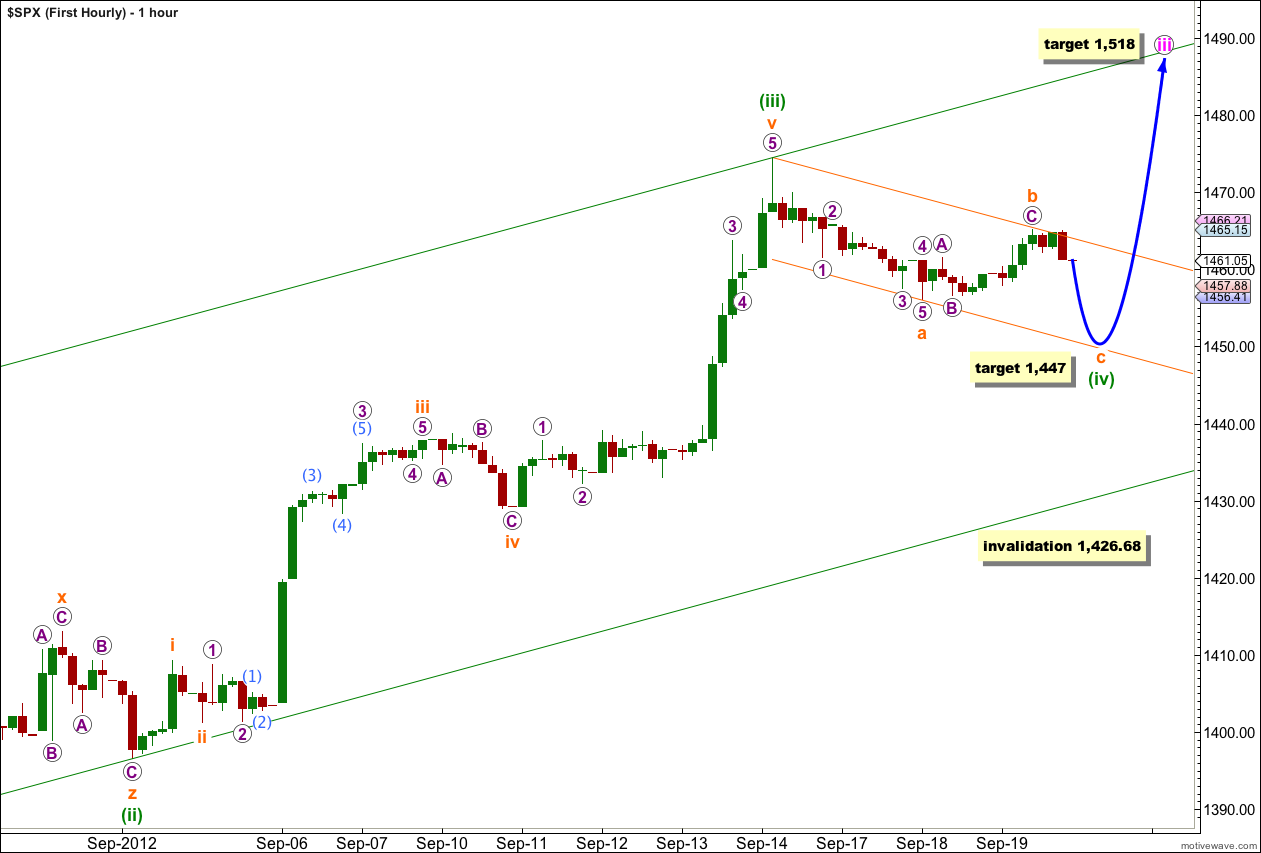
Slow upwards movement for Wednesday’s session may be a continuation of wave (iv) green. The downwards movement labeled here wave a orange is ambiguous; it may be seen as either a five or a double three.
Wave (ii) green lasted 9 days so it is reasonable to expect wave (iv) green to yet last a few more days.
At 1,447 wave c orange would reach equality with wave a orange.
Use Elliott’s channeling technique to draw a small parallel channel about wave (iv) green. Wave c orange may end about the lower edge of this channel. When this small orange channel is breached clearly by upwards movement then wave v orange may be underway towards the target 1,518.
Wave (iv) green may not move into wave (i) green price territory. This wave count is invalidated with movement below 1,426.68.
Second Wave Count.
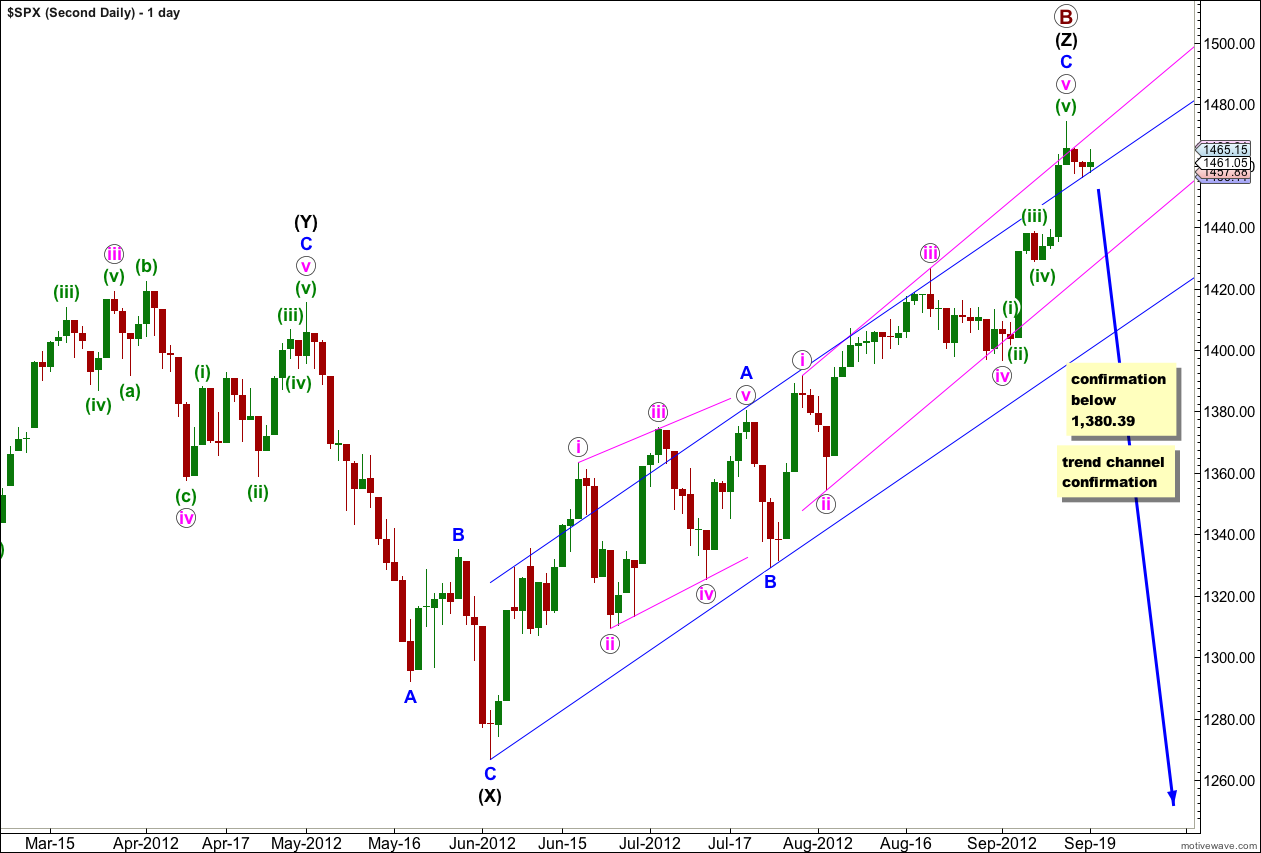
If we use the same labeling for subdivisions within wave v pink as the first wave count is using then it is possible again that we may have seen an end to upwards movement. Alternatively, we can use the labeling that I used yesterday which agrees with MACD and expects more upwards movement to 1,513 before a trend change.
If primary wave B is finally over we have absolutely no confirmation of this yet.
Movement initially below the parallel channel on the hourly chart would be required. Thereafter, movement below 1,426.68 would provide a little confidence in a possible trend change.
Movement below 1,380.39 would take price back into what is wave 1 blue price territory for the first monthly wave count, and that would tip the balance in favour of this second wave count. If price does not move below this point we must allow for the reasonable possibility that we shall see new all time highs within a few months.
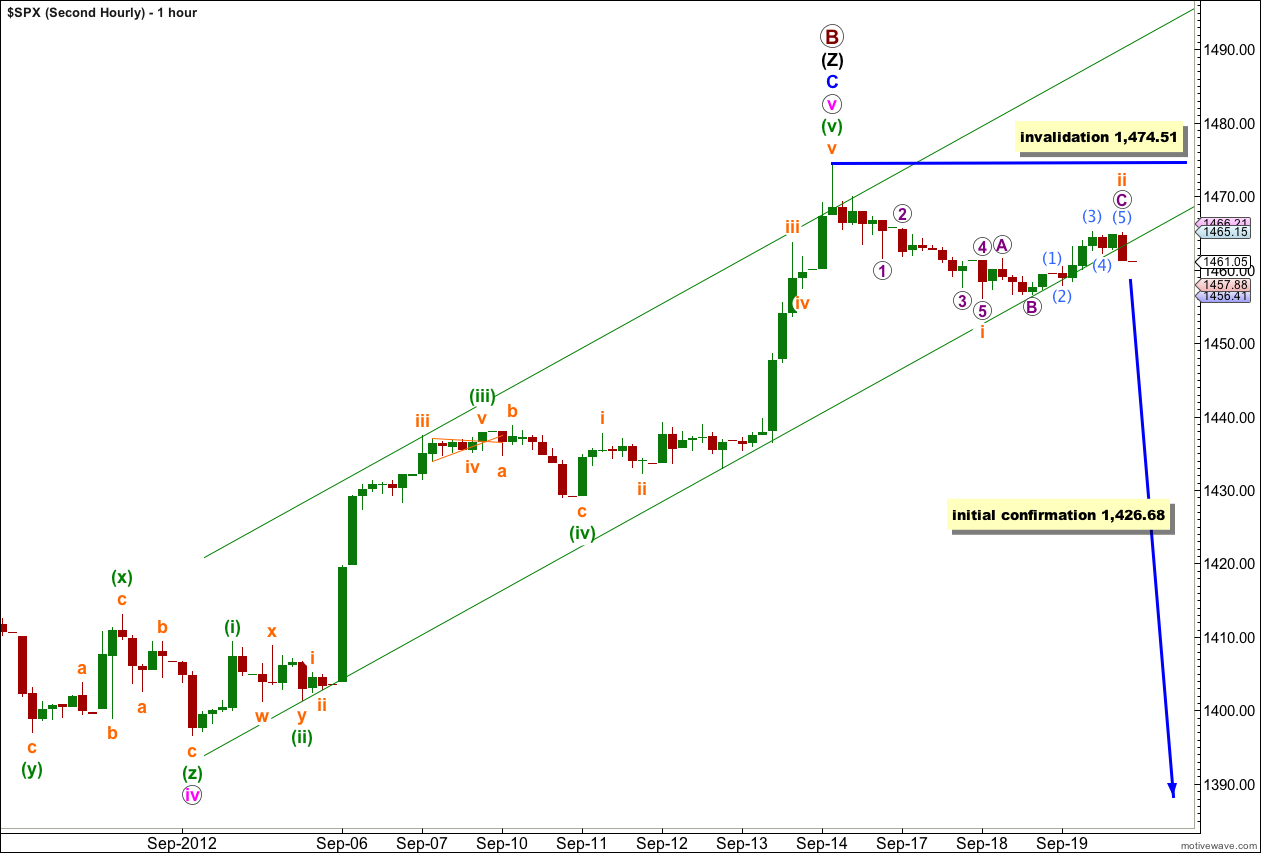
While price has not moved above 1,474.51 it remains possible that we have seen a trend change, but we have zero confirmation at this stage. This is just a possibility we may be aware of.
So far downwards movement labeled wave i orange may be a five wave impulse and upwards movement may be a zigzag.
If the next wave down is a third wave it should exhibit an increase in downwards momentum.
If price moves above 1,474.51 invalidating this labeling then I would expect that upwards movement would be wave (v) green within wave v pink to end wave C blue. At that stage I would use the target of 1,513.