
I still have the same two monthly wave counts running alongside each other, with about equal probability at this stage. The historical analysis has been updated and you can see monthly charts here.
With more sideways and slightly lower movement yesterday I have readjusted the hourly wave count slightly. This changes the target by 5 points and the invalidation point moves slightly lower for the first wave count.
Click on the charts below to enlarge.
First Wave Count.
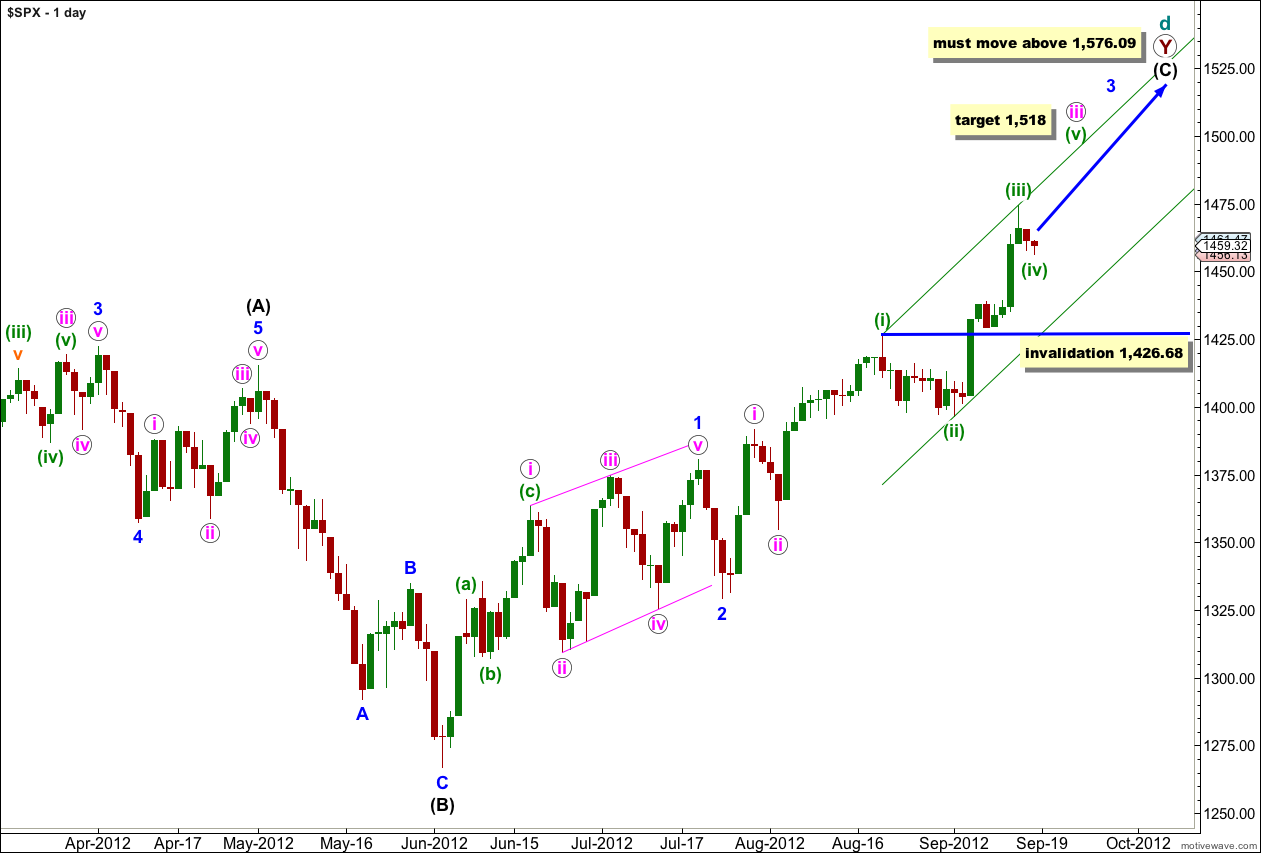
Wave (C) black must unfold as a five wave structure.
Waves 1 and 2 blue are complete. At this stage wave 3 blue is unfolding upwards as an impulse.
Within wave 3 blue at 1,518 wave iii pink would reach 2.618 the length of wave i pink.
Any further downwards movement for wave (iv) green may not move into wave (i) green price territory. This wave count is invalidated with movement below 1,426.68.
This sideways movement is now more in proportion to wave (ii) green and it is likely to be wave (iv) green.
Within wave (iii) green this wave count does not agree with MACD, but that’s okay as MACD should be used as a guide and not as a definitive aid for the wave count.
Wave (iii) green is 5.92 points longer than equality with wave (i) green.
Ratios within wave (iii) green are: wave iii orange is 3.17 points longer than 2.618 the length of wave i orange, and wave v orange has no Fibonacci ratio to either of waves i or iii orange.
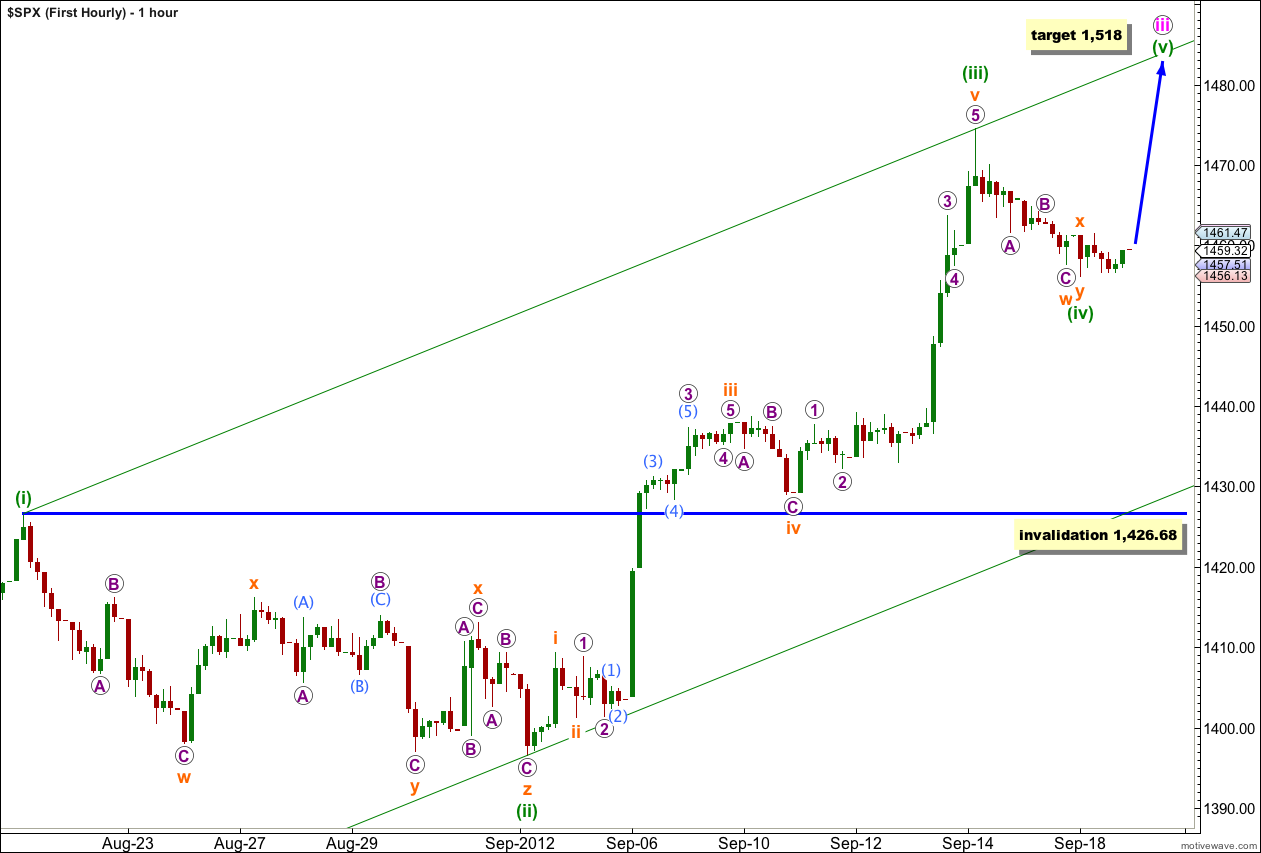
It is unclear whether or not wave (iv) green is over. There is not a clear five up on the 5 minute chart at the end of Tuesday’s session to confirm an end to this fourth wave correction.
Wave (iv) green may extend further. If it does it may not move into wave (i) green price territory. This wave count is invalidated with movement below 1,426.68.
If wave (iv) green does move further sideways and lower it may find support at the lower edge of the parallel channel drawn here using Elliott’s first technique.
Second Wave Count.
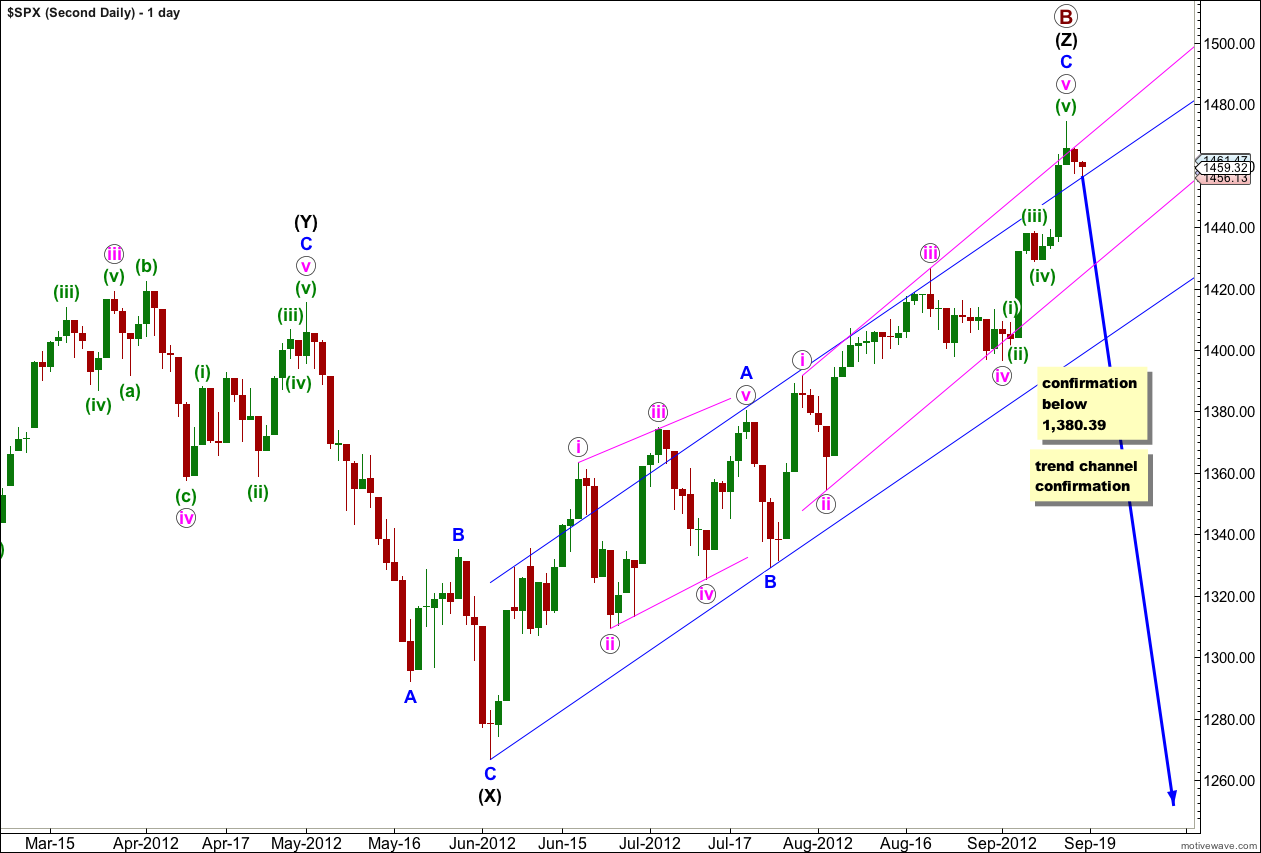
If we use the same labeling for subdivisions within wave v pink as the first wave count is using then it is possible again that we may have seen an end to upwards movement. Alternatively we can use the labeling that I used yesterday which agrees with MACD and expects more upwards movement to 1,513 before a trend change.
If primary wave B is finally over we have absolutely no confirmation of this yet.
Movement initially below the parallel channel on the hourly chart would be required. Thereafter, movement below 1,426.68 would provide a little confidence in a possible trend change.
Movement below 1,380.39 would take price back into what is wave 1 blue price territory for the first monthly wave count, and that would tip the balance in favour of this second wave count. If price does not move below this point we must allow for the reasonable possibility that we shall see new all time highs within a few months.
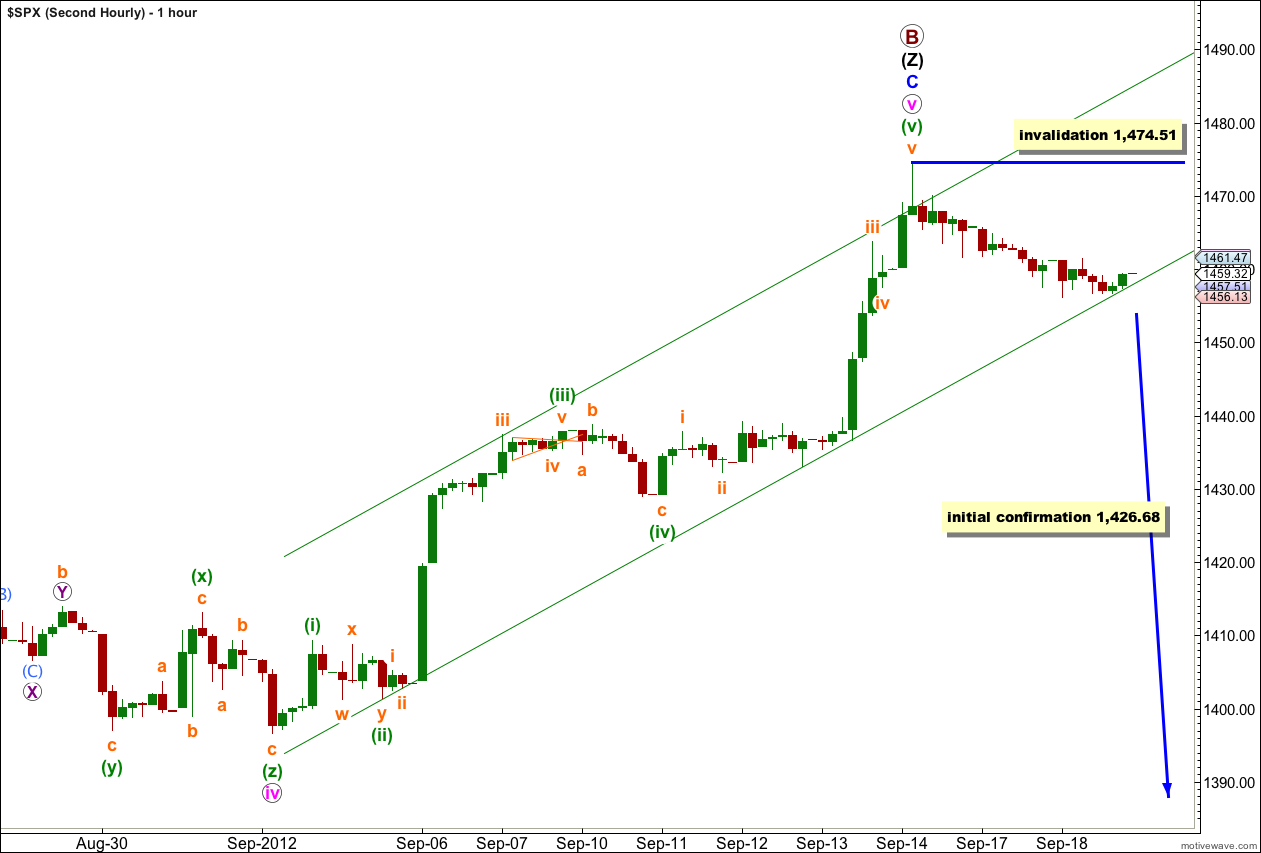
At the hourly chart level the subdivisions are seen in the same way as the first wave count.
Movement above 1,474.51 would invalidate this labeling. At that stage I would revert to how this hourly chart was labeled here yesterday.