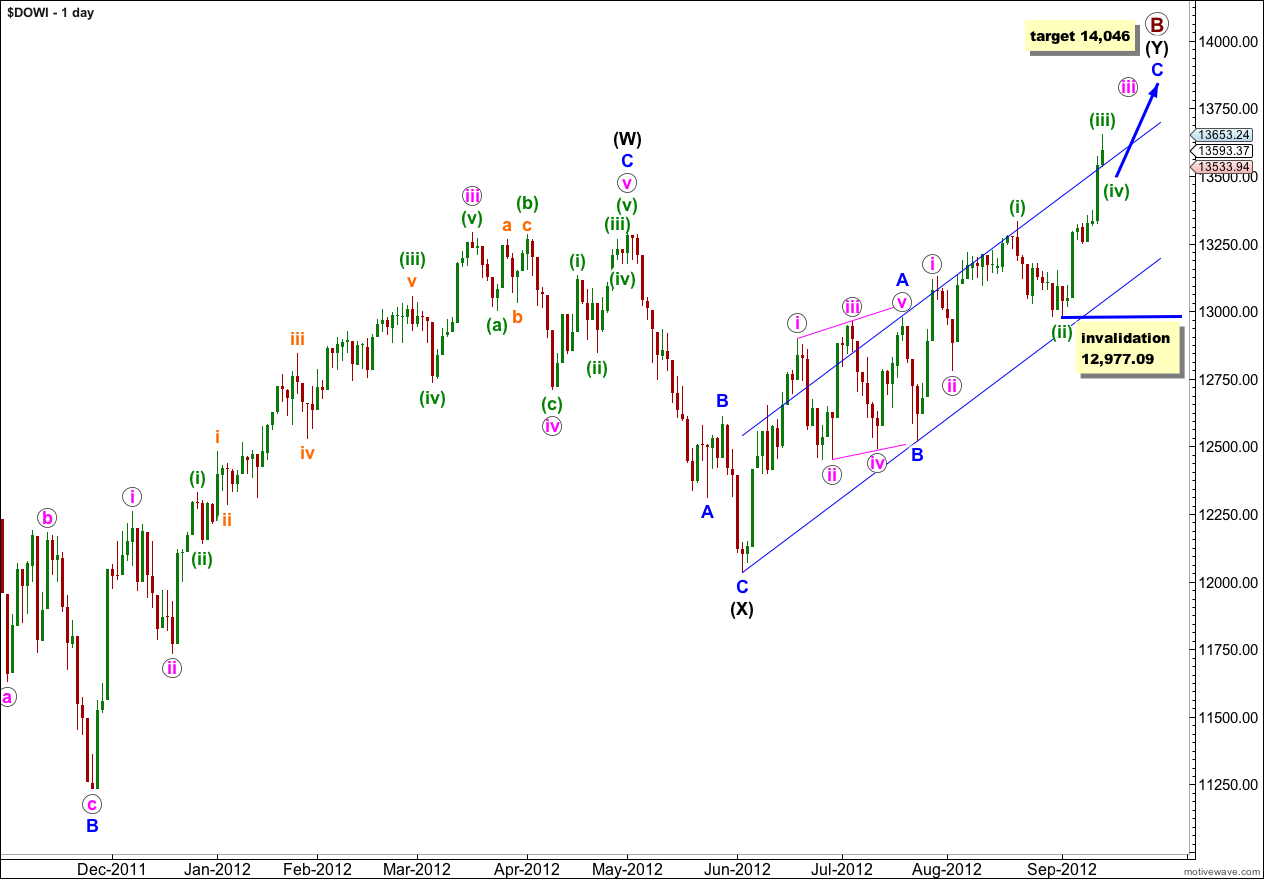
Movement above 13,338.66 invalidated the main daily wave count and confirmed the alternate daily wave count. At that stage the target for upwards movement was at 13,529. Price has reached 124 points above the target so far.
I have just the one daily and one hourly wave counts for you for the next week. With upwards movement incomplete the target has been recalculated.
Click on the charts below to enlarge.
Wave C blue is not unfolding as an ending diagonal because the third wave within it cannot be the shortest wave. The only other possible structure is an impulse with an extended third wave.
Wave iii pink within wave C blue is incomplete.
Within wave iii pink wave (iii) green is close to completion and it should end next week.
Primary wave B is an incomplete double zigzag. When the second zigzag of wave (Y) black is complete the probability that primary wave B would be complete is very high. The only way it could continue further would be as a very rare triple zigzag.
At 14,046 wave C blue would reach 1.618 the length of wave A blue.
When waves iii and iv pink within wave C blue are complete I will use the pink wave degree to refine this target, so please note target may change.
Within wave (iii) green no second wave correction may move beyond the start of its first wave. This wave count is invalidated with movement below 12,977.09.
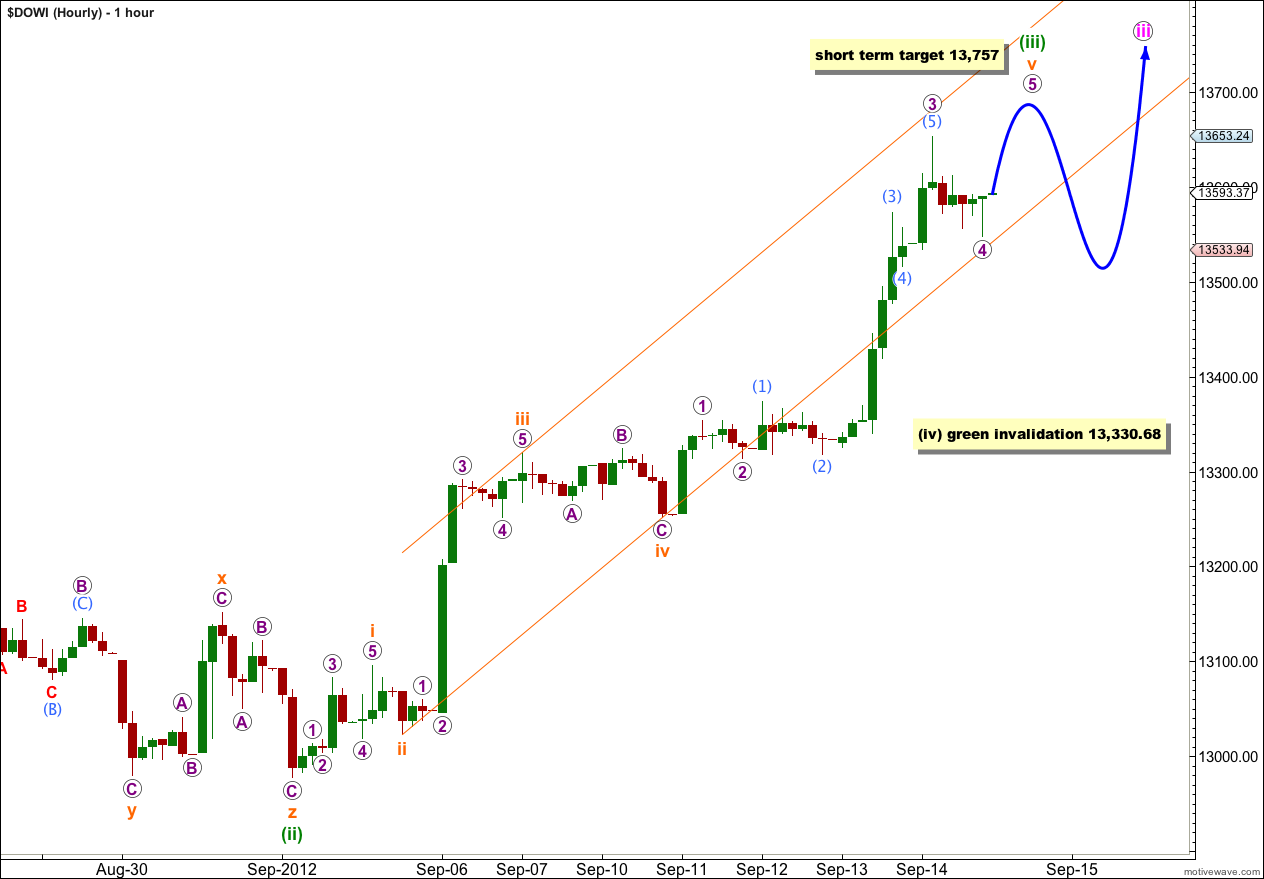
The hourly chart shows the structure within wave (iii) green.
Within wave (iii) green wave iii orange is 13.51 points short of 2.618 the length of wave i orange. Because there is already a Fibonacci ratio within wave (iii) green I am not expecting to see a Fibonacci ratio between wave v orange and either of i or iii orange.
Within wave v orange wave 3 purple has no Fibonacci ratio to wave 1 purple. I would therefore expect to see a Fibonacci ratio between wave 5 purple and either of 1 or 3 purple. At 13,757 wave 5 purple would reach 0.618 the length of wave 3 purple.
Thereafter, wave (iv) green may not move back into wave (i) green price territory. This wave count is invalidated with movement below 13,330.68.
The parallel channel is drawn here using Elliott’s second technique. Draw the first trend line from the lows of waves ii to iv orange, then place a parallel copy upon the high of wave iii orange. Wave v orange may end about the upper edge of this channel. Wave (iv) green should breach the channel to the downside.


