
Last analysis had two target zones. Price has reached just above the upper edge of the higher second target zone which was 1,451 – 1,459.
At this stage a careful analysis of the structure which has unfolded so far should be able to tell us if this trend is over or has yet more life left in it.
I have just one daily and hourly wave count for you today.
Click on the charts below to enlarge.
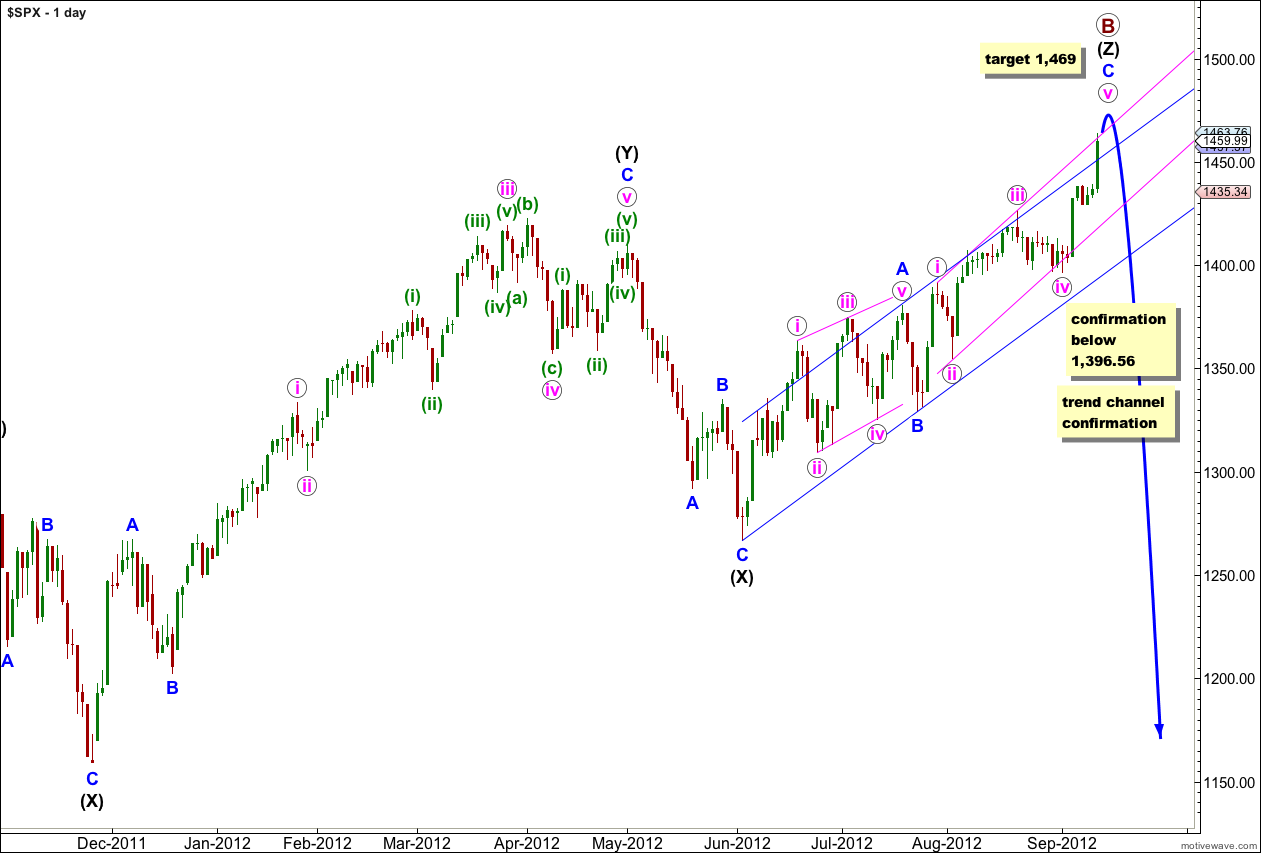
At this stage upwards movement from the low of the second (X) black is very choppy, overlapping and typically corrective. It has a corrective count of 11.
This upwards movement (from the low labeled primary wave A) has a lot of overlapping three wave structures within it. Because the upwards wave labeled intermediate (black) (W) can only be seen as a three wave structure, the only structure that fits for this entire movement within this wave count is a triple zigzag.
The only other Elliott wave structure which has these subdivisions is a leading (or ending) diagonal. This would fit within the second alternate monthly wave count which may be found here. It could also possibly fit as an ending diagonal for the first monthly alternate, the expanding triangle scenario.
At primary degree the structure unfolding is an expanded flat correction. Within this structure the maximum common length of primary wave B would be about 1,464 which is 138% the length of primary wave A. Price is right at this point today.
Within wave (Z) black wave A blue was a leading contracting diagonal. Wave B blue was a brief zigzag. Wave C blue is exhibiting alternation with wave A blue and unfolding as an impulse.
Within wave C blue wave i pink lasted 4 sessions and wave iii pink lasted 13 sessions. I would expect wave v pink to last between 4 and 13 sessions. If wave v pink is to have a Fibonacci duration it may end after 2 more sessions, lasting a Fibonacci 8 sessions. The next Fibonacci number in the sequence would be 13, this would be met in another 7 sessions.
When the parallel channel about wave (Z) black is clearly breached by downwards movement then we shall have confirmation of a trend change.
Keep drawing the parallel channel about wave C blue. Draw the first trend line from the highs of i to iii pink, place a parallel copy upon the low of wave ii pink. Wave v pink may find resistance here at the upper edge of the channel, and it looks like we are seeing a very small overshoot.
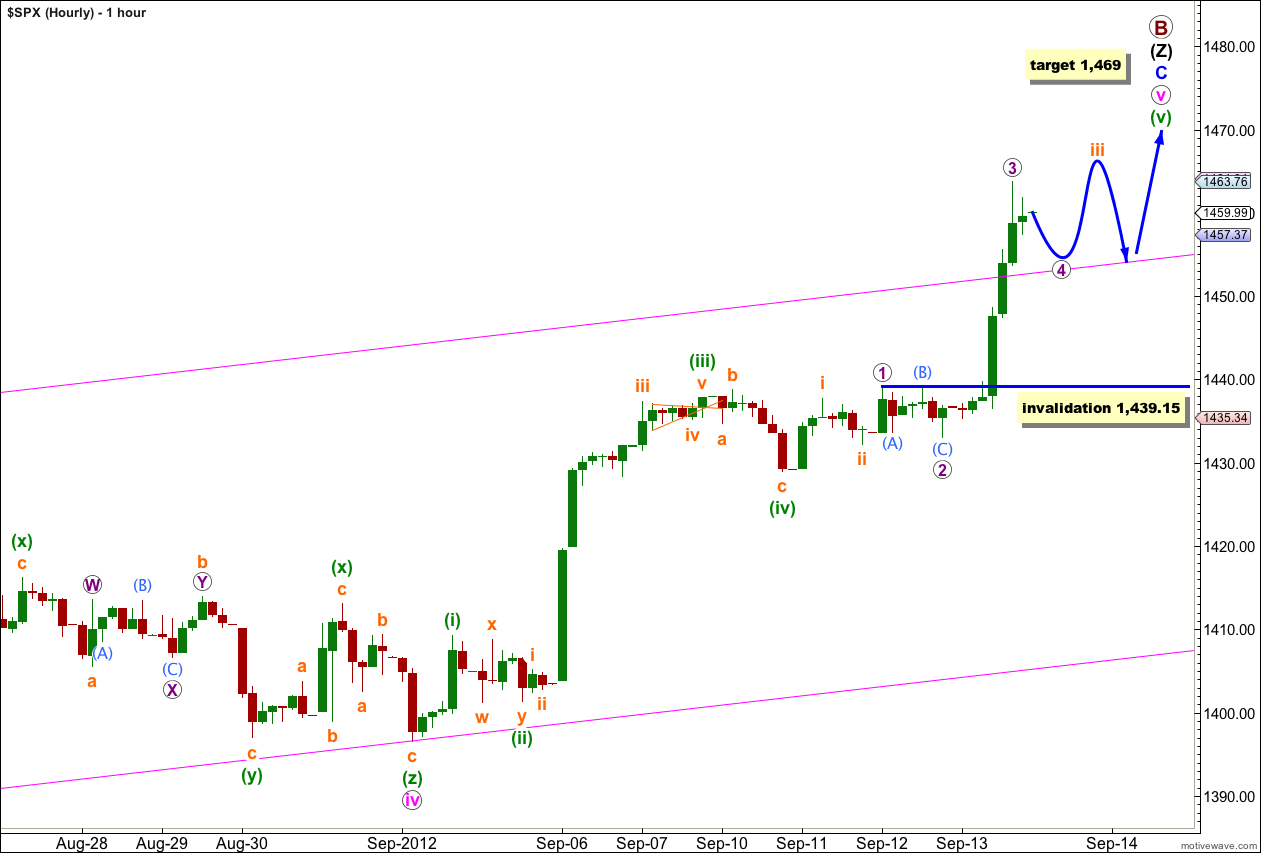
This wave count was yesterday’s first alternate. The strong upwards momentum we saw during Thursday’s session fits this wave count nicely.
Within wave (v) green the middle of the third wave, wave iii orange, is almost complete.
Within wave iii orange wave 3 purple is just 1.41 points longer than 4.236 the length of wave 1 purple. Wave 4 purple does not look like it is complete on the 5 and 1 minute charts, and the downwards movement to end Thursday’s session subdivides best as a five and not a three so only wave (A) aqua may be complete.
Wave 4 purple may not move into wave 1 purple price territory. This wave count is invalidated with movement below 1,439.15.
When wave 4 purple is complete we should expect more upwards movement for wave 5 purple to complete wave iii orange.
When wave iii orange is complete we should expect a session or two of corrective movement for wave iv orange. Downwards movement for wave iv orange may find some support about the upper edge of the parallel channel.
Finally wave v orange upwards should complete the entire structure up to primary wave degree.
This structure looks like it will now take another 5 sessions to complete for wave v pink to have a total of a Fibonacci 13 sessions.