
Analysis for Tuesday 11th September expected the S&P 500 to continue to rise to new highs. A new high was made yesterday on the 12th as expected.
I have still the one daily wave count for you today plus three hourly alternate wave counts. The hourly wave counts all have the same mid term targets with the first two having the same expectation for direction in the short term, but with slightly different invalidation points.
Click on the charts below to enlarge.
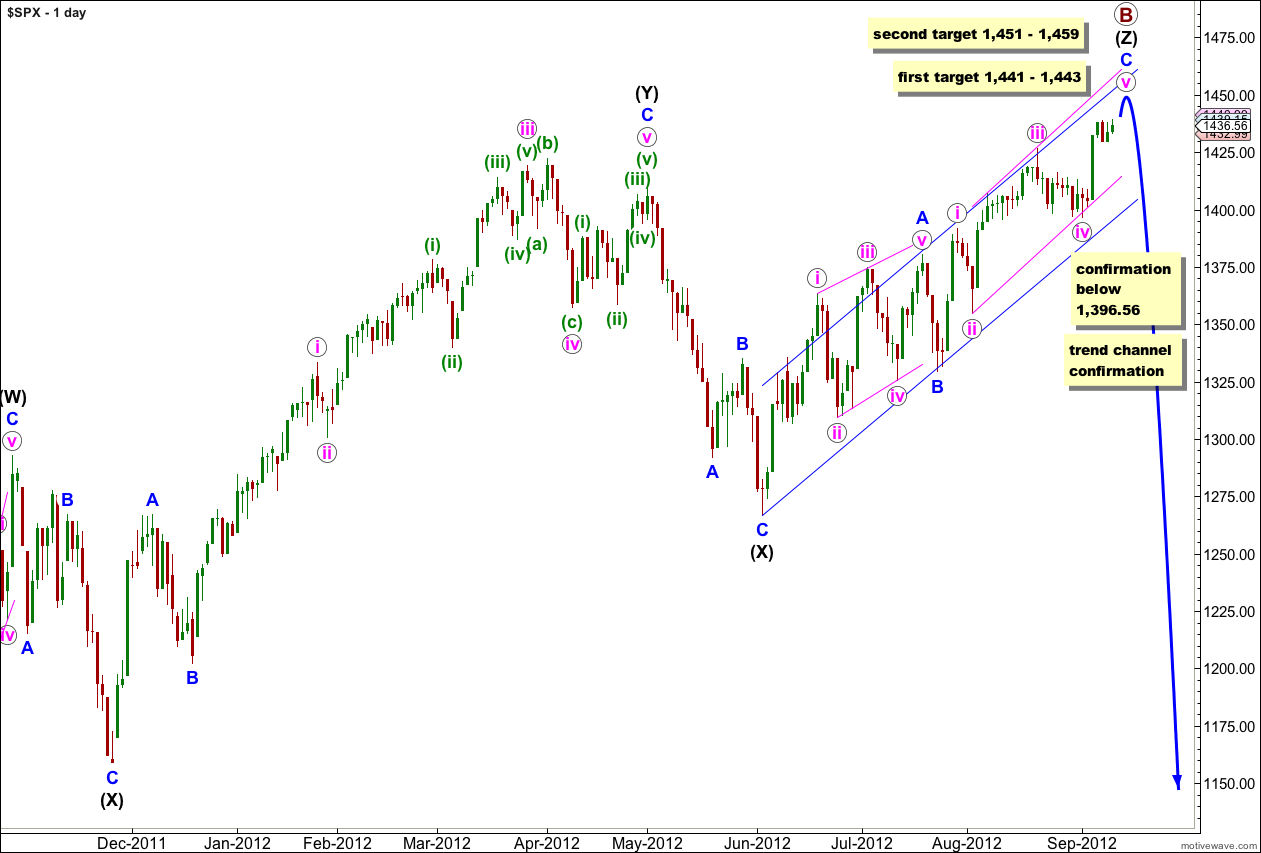
At this stage upwards movement from the low of the second (X) black is very choppy, overlapping and typically corrective. It has a corrective count of 11.
This upwards movement (from the low labeled primary wave A) has a lot of overlapping three wave structures within it. Because the upwards wave labeled intermediate (black) (W) can only be seen as a three wave structure, the only structure that fits for this entire movement within this wave count is a triple zigzag.
The only other Elliott wave structure which has these subdivisions is a leading (or ending) diagonal. This would fit within the second alternate monthly wave count which may be found here. It could also possibly fit as an ending diagonal for the first monthly alternate, the expanding triangle scenario.
Within wave (Z) black wave A blue was a leading contracting diagonal. Wave B blue was a brief zigzag. Wave C blue is exhibiting alternation with wave A blue and unfolding as an impulse.
Within wave C blue wave i pink lasted 4 sessions and wave iii pink lasted 13 sessions. I would expect wave v pink to last between 4 and 13 sessions. If wave v pink is to have a Fibonacci duration it may end after 2 more sessions, lasting a Fibonacci 8 sessions. The next Fibonacci number in the sequence would be 13, this would be met in another 7 sessions.
When the parallel channel about wave (Z) black is clearly breached by downwards movement then we shall have confirmation of a trend change.
Keep drawing the parallel channel about wave C blue. Draw the first trend line from the highs of i to iii pink, place a parallel copy upon the low of wave ii pink. Expect wave v pink to find resistance at the upper edge of this channel.
Main Hourly Wave Count.
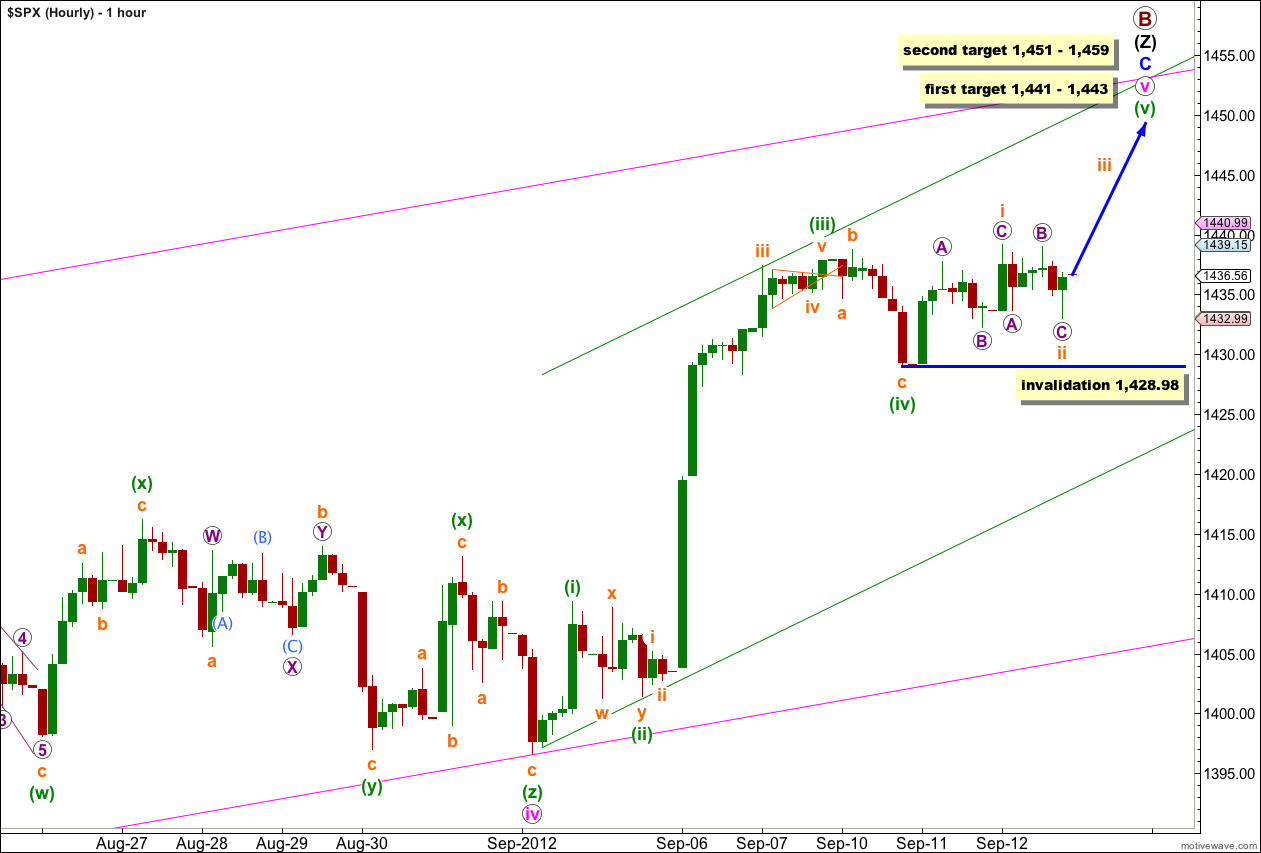
Wave (iv) green is most likely a complete expanded flat correction.
Wave (v) green may be unfolding as an ending diagonal. An ending diagonal requires all the subwaves to subdivide into zigzags, and wave 4 should overlap wave 1 price territory. Within the diagonal wave ii orange may not move beyond the start of wave i orange. This wave count is invalidated with movement below 1,428.98.
At 1,443 wave C blue would reach equality in length with wave A blue. At 1,441 wave v pink would reach 0.618 the length of wave iii pink. At 1,442 wave (v) green would reach equality in length with wave (i) green. This two point target zone has the highest probability because it is calculated at three wave degrees.
At 1,451 wave (v) green would reach 0.618 the length of wave (iii) green. At 1,459 wave v pink would reach equality in length with wave i pink. This second target zone has a slightly lower probability because it is calculated at only two wave degrees.
This main wave count expects upwards movement tomorrow and overall upwards movement for another 2 to 7 sessions. Upwards movement would be slowing in momentum, choppy and overlapping.
First Alternate Hourly Wave Count.
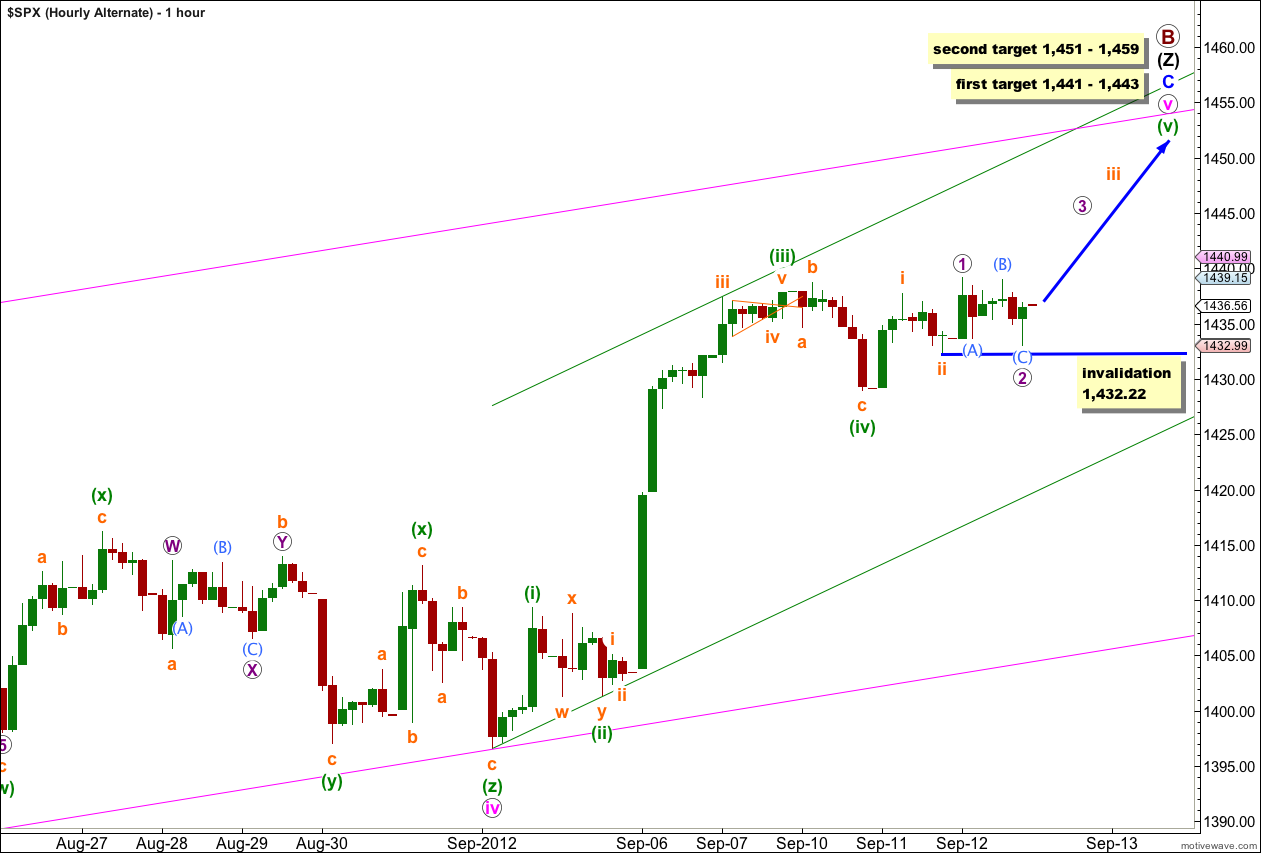
Alternately, wave (v) green may be unfolding as a simple impulse with a third wave extension. If this is the case then wave 2 purple may not move beyond the start of wave 1 purple. This alternate is invalidated with movement below 1,432.22.
This alternate expects upwards movement tomorrow as does the main hourly wave count. The only difference is in momentum. This alternate expects an increase in upwards momentum.
For this alternate the second higher target has a much better fit.
Second Alternate Hourly Wave Count.
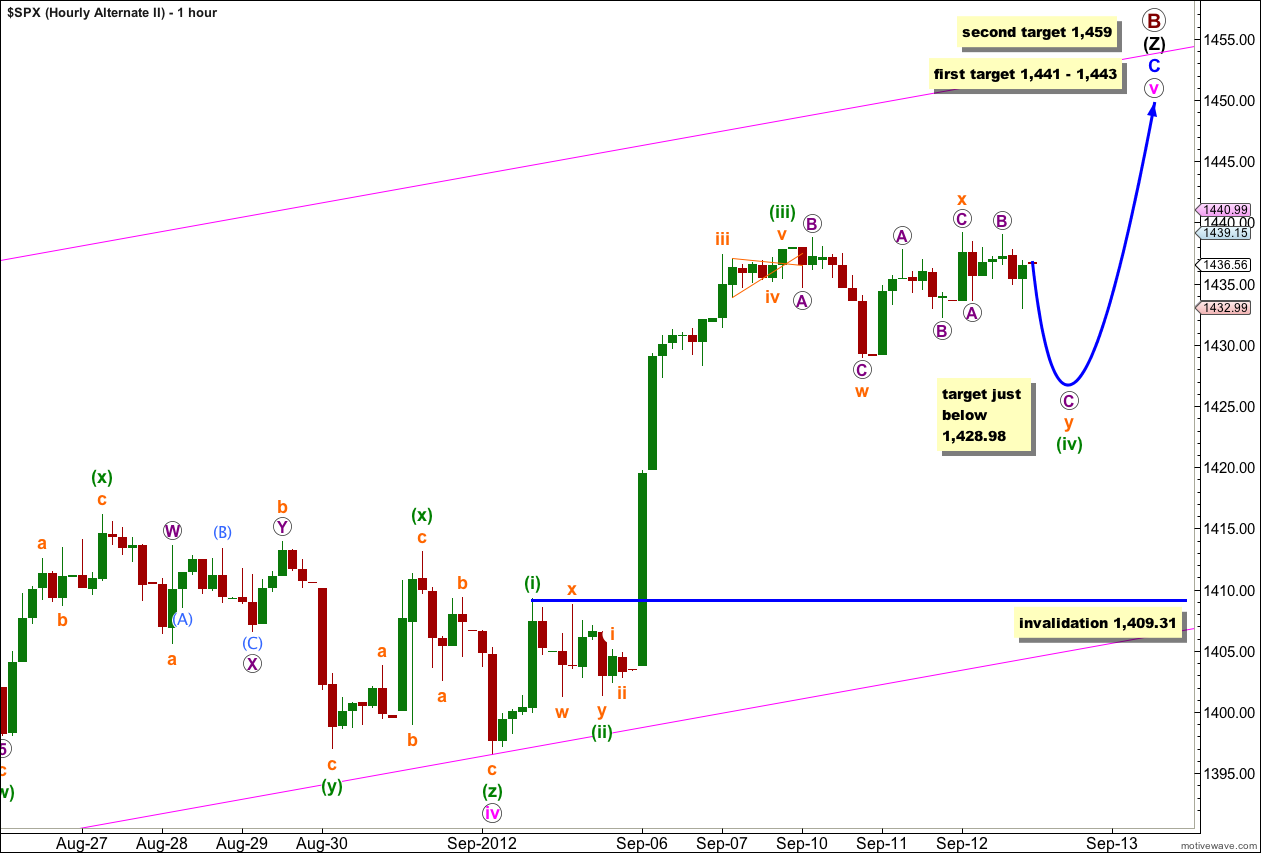
It remains possible that wave (iv) green is not over. The new high above 1,438.74 has reduced the probability of this wave count, but not invalidated it. Wave x orange may make a new high beyond the start of wave w orange.
If this wave count is correct then wave (iv) green would be quite out of proportion in terms of duration to wave (ii) green. This further reduces the probability that this wave count is correct.
If the first two hourly wave counts are invalidated in the next session or two then this alternate would be a good explanation.
Overall it also expects new highs, but it sees more sideways and slightly lower movement first.
Wave (iv) green if incomplete would likely be unfolding as a double flat. The purpose of double flats is to take up time and move price sideways. This is why I would expect it to end just very slightly below 1,428.98 and not significantly lower.
Wave (iv) green may not move into wave (i) green price territory. This wave count is invalidated with movement below 1,409.31.