
The S&P 500 has moved higher, within allowable limits, and the hourly and daily charts both remain valid.
However, at this stage I am swapping the hourly charts over. What yesterday was the alternate now has a slightly higher probability. This is because, with the Dow making a new high, I expect both the Dow and S&P 500 to move together for the immediate future.
Click on the charts below to enlarge.
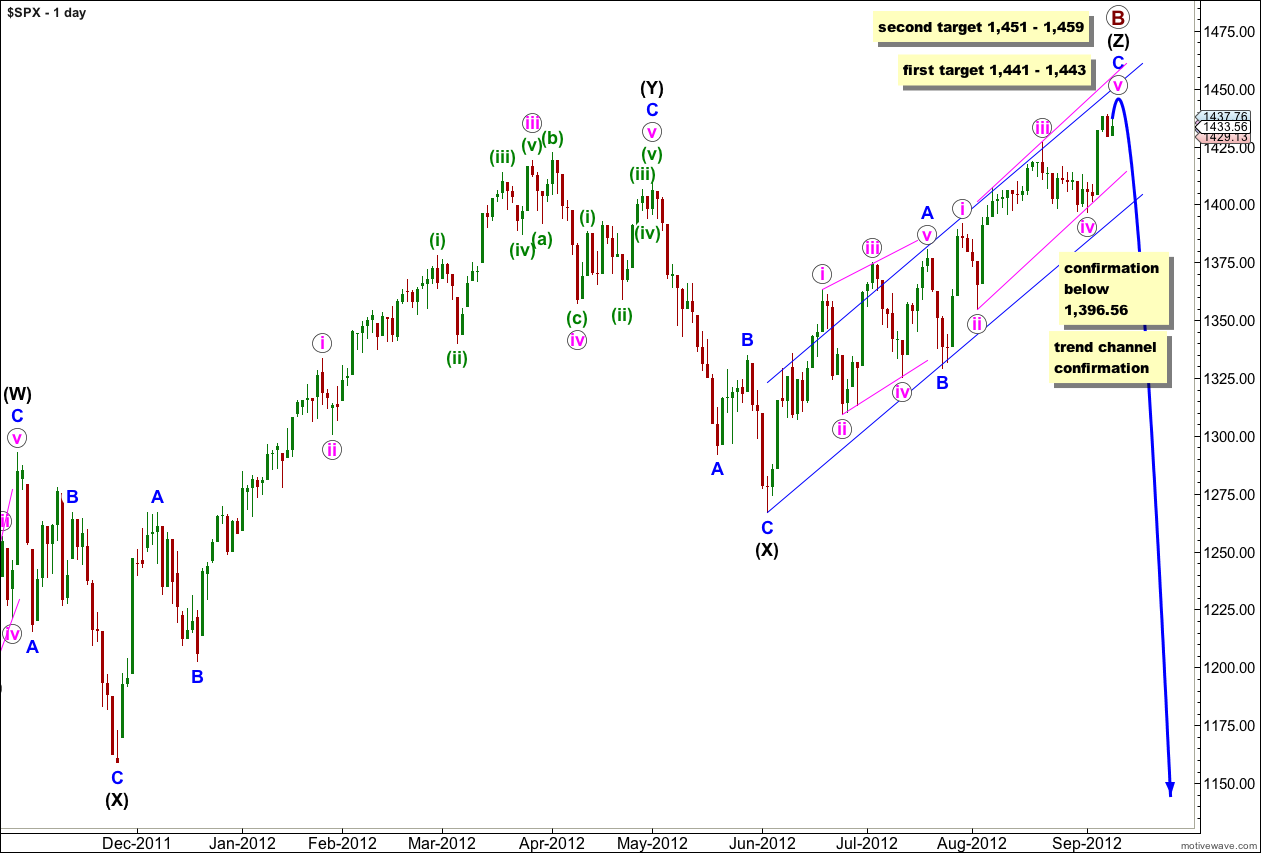
The Dow has made a new high and looks like it has not changed trend yet, and probably will not do so for several days or a very few weeks. It is likely the S&P 500 will follow suit and trend higher for a while. For this reason I have calculated a new higher target. If price rises through the first target then the second target would be the next likely place for this trend to end.
At this stage upwards movement from the low of the second (X) black is very choppy, overlapping and typically corrective. It has a corrective count of 11.
This upwards movement (from the low labeled primary wave A) has a lot of overlapping three wave structures within it. Because the upwards wave labeled intermediate (black) (W) can only be seen as a three wave structure, the only structure that fits for this entire movement within this wave count is a triple zigzag.
The only other Elliott wave structure which has these subdivisions is a leading (or ending) diagonal. This would fit within the second alternate monthly wave count which may be found here. It could also possibly fit as an ending diagonal for the first monthly alternate, the expanding triangle scenario.
Within wave (Z) black wave A blue was a leading contracting diagonal. Wave B blue was a brief zigzag. Wave C blue is exhibiting alternation with wave A blue and unfolding as an impulse.
When the parallel channel about wave (Z) black is clearly breached by downwards movement then we shall have confirmation of a trend change.
Today I have a main and an alternate hourly wave count for you. The main hourly wave count expects more upwards movement.
Main Hourly Wave Count.
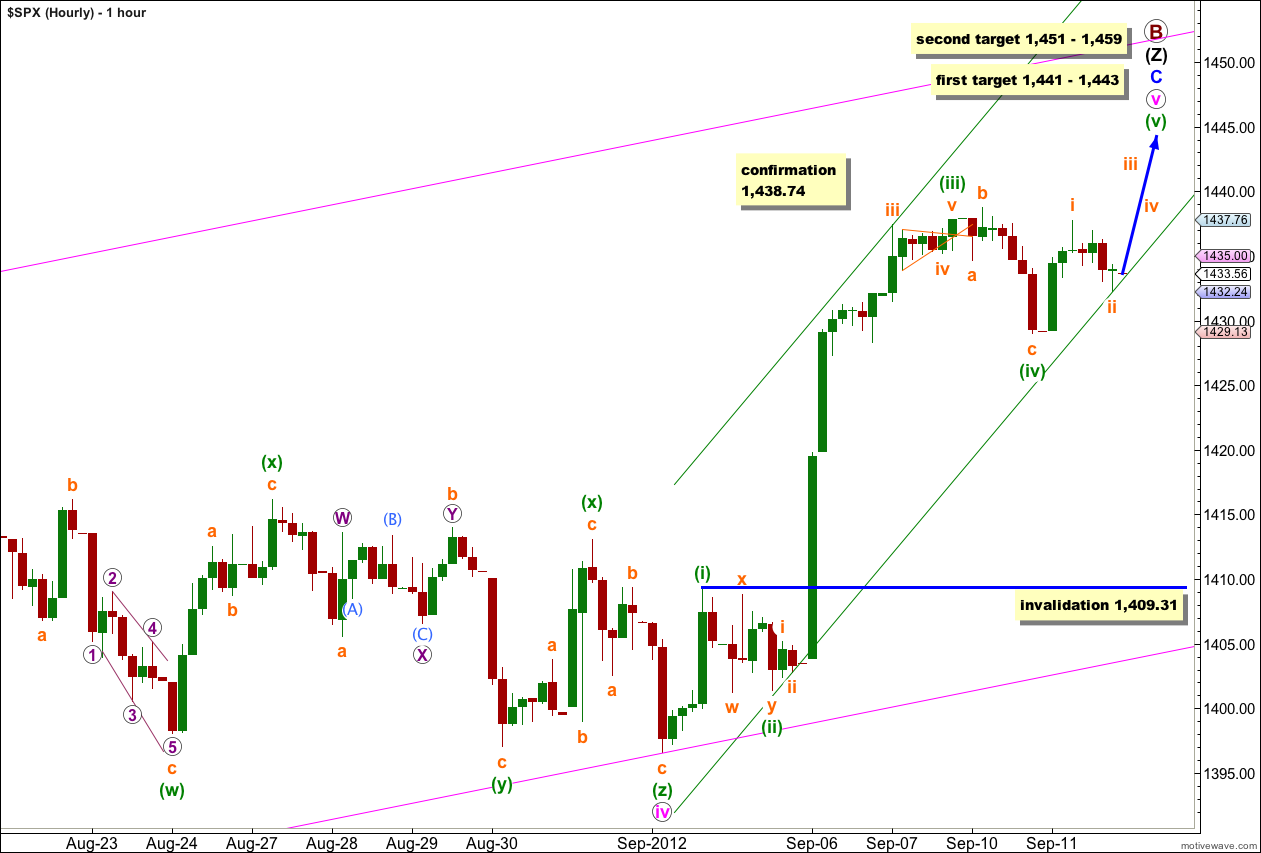
Wave (iv) green is a complete expanded flat correction. Until we have a new high above 1,438.74 there will remain the reasonable possibility that this expanded flat is just the first of two corrective structures within a double for wave (iv) green, and doubles are fairly common. This is why I will leave the invalidation point at 1,409.31. If wave (iv) green does extend sideways and a little lower it may not move into wave (i) green price territory.
At 1,443 wave C blue would reach equality in length with wave A blue. At 1,441 wave v pink would reach 0.618 the length of wave iii pink. At 1,442 wave (v) green would reach equality in length with wave (i) green. This two point target zone has the highest probability because it is calculated at three wave degrees.
At 1,451 wave (v) green would reach 0.618 the length of wave (iii) green. At 1,459 wave v pink would reach equality in length with wave i pink. This second target zone has a slightly lower probability because it is calculated at only two wave degrees.
Keep drawing the parallel channel about wave C blue. Draw the first trend line from the highs of i to iii pink, place a parallel copy upon the low of wave ii pink. Expect wave v pink to find resistance at the upper edge of this channel.
Wave i pink lasted 4 sessions and wave iii pink lasted 13 sessions. If this wave count is correct then wave v pink may turn out to be longer lasting, close to 13 sessions.
Alternate Hourly Wave Count.
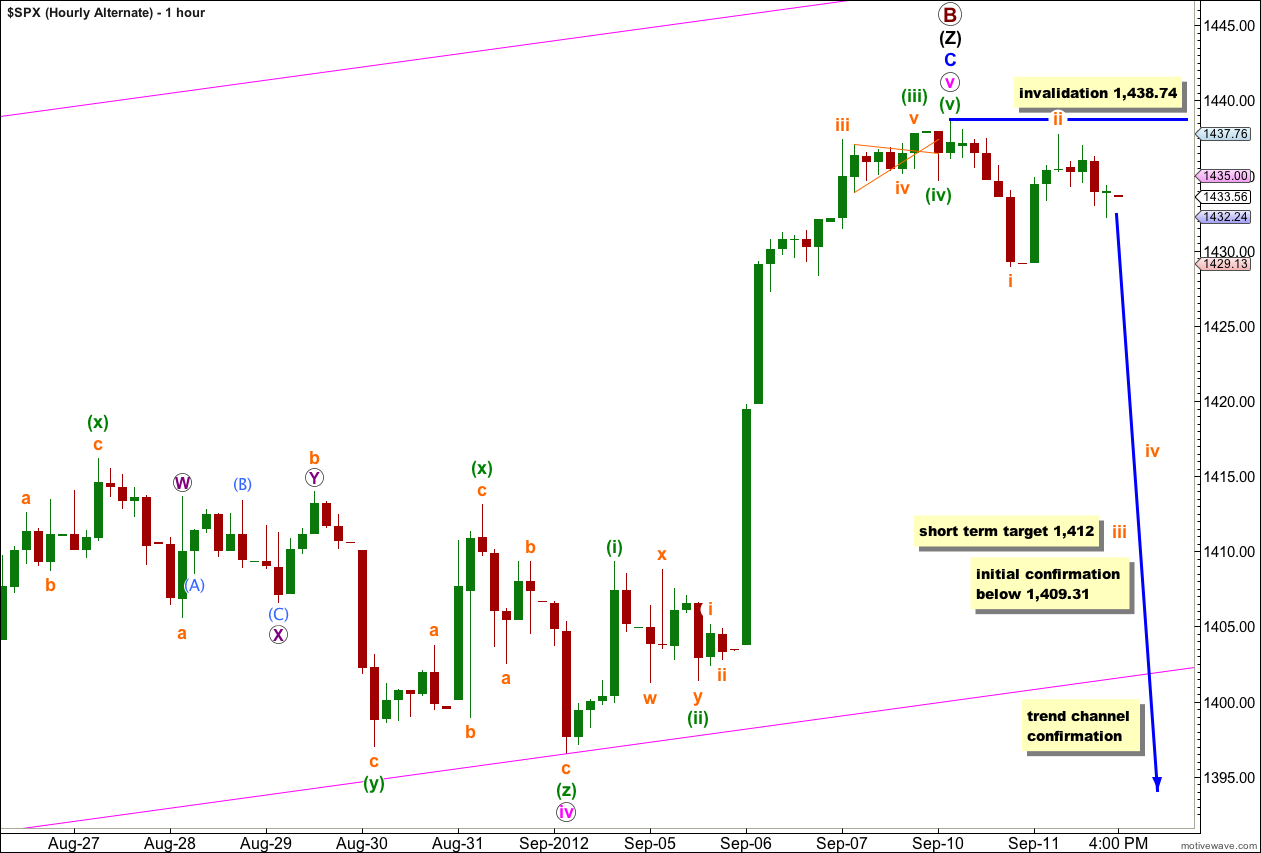
While price does not move above 1,438.74 it will remain possible that primary wave B is over. However, we should assume the trend remains the same until proven otherwise. We need to see price move below 1,409.31 to have our first indication that this wave count is correct.
Only when we can see a clear breach of the parallel channel on the daily chart, and movement to a new low below 1,396.56 can we have confidence in a trend change.
This trend change is very big. Primary wave C should last months and take price to new lows below the end of primary wave A at 1,074.77. Because of the high wave degree in this trend change it is important to have some confirmation before calling a high in place.