
Price moved very slightly higher to begin Monday’s session, before turning lower. This is exactly what the last analysis expected, and upwards movement has fallen 2.26 points short of the narrow target zone.
So far the main wave count is explaining price action nicely. However, it is important to always assume the trend remains the same until proven otherwise. The trend is your friend.
I will be using the invalidation point of the alternate wave count as an important price point to indicate a trend change, along with parallel channels on both daily and hourly charts.
Click on the charts below to enlarge.
It is possible that we have seen a big trend change early during Monday’s session. However, we have absolutely no confirmation of a trend change. We need to see price move below 1,409.31 in the first instance, then below 1,396.56. Movement to a new low below 1,396.56 would fully confirm that the last upwards wave labeled v pink must be over, and the whole movement would very likely be over.
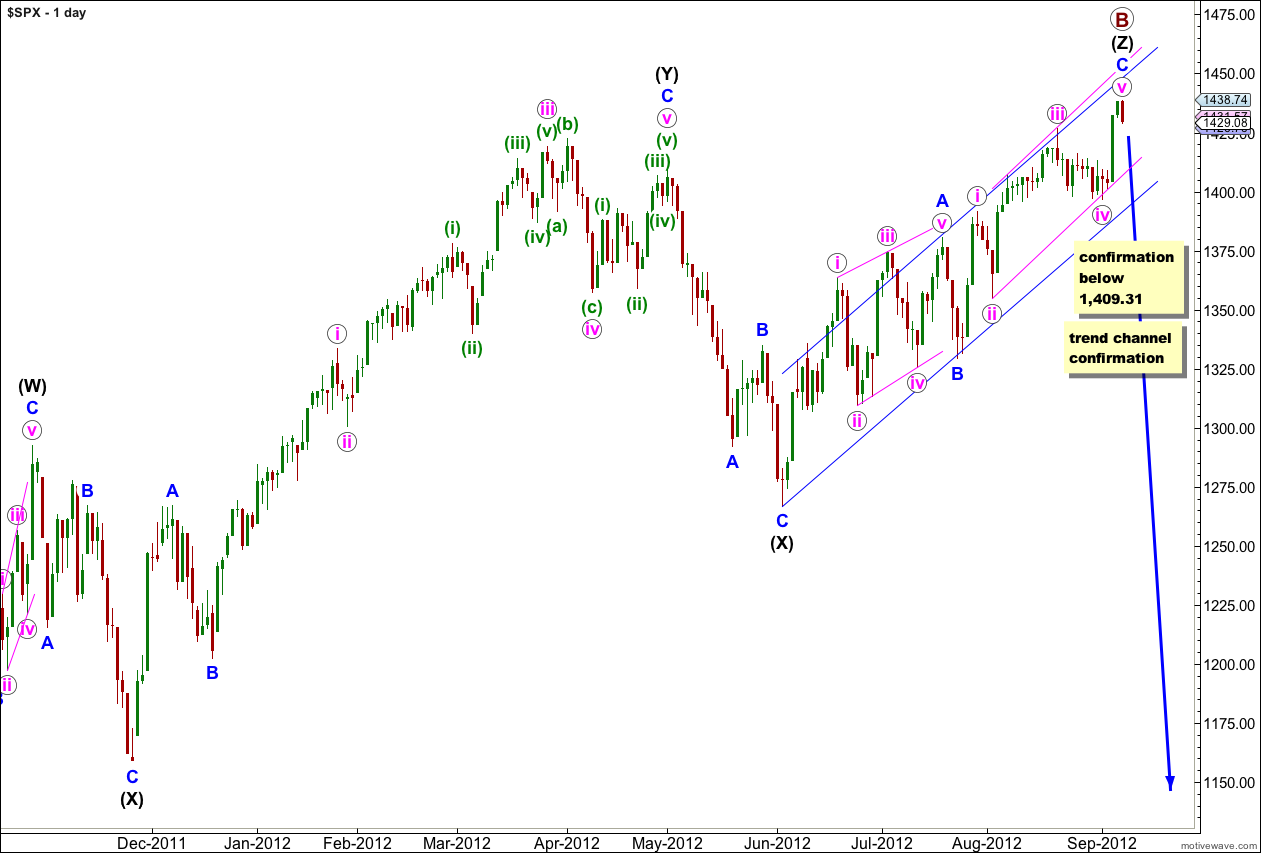
At this stage upwards movement from the low of the second (X) black is very choppy, overlapping and typically corrective. It has a corrective count of 11.
This upwards movement (from the low labeled primary wave A) has a lot of overlapping three wave structures within it. Because the upwards wave labeled intermediate (black) (W) can only be seen as a three wave structure, the only structure that fits for this entire movement within this wave count is a triple zigzag.
The only other Elliott wave structure which has these subdivisions is a leading (or ending) diagonal. This would fit within the second alternate monthly wave count which may be found here. It could also possibly fit as an ending diagonal for the first monthly alternate, the expanding triangle scenario.
Within wave (Z) black wave A blue was a leading contracting diagonal. Wave B blue was a brief zigzag. Wave C blue is exhibiting alternation with wave A blue and unfolding as an impulse.
When the parallel channel about wave (Z) black is clearly breached by downwards movement then we shall have confirmation of a trend change.
Today I have a main and an alternate hourly wave count for you.
Main Hourly Wave Count.
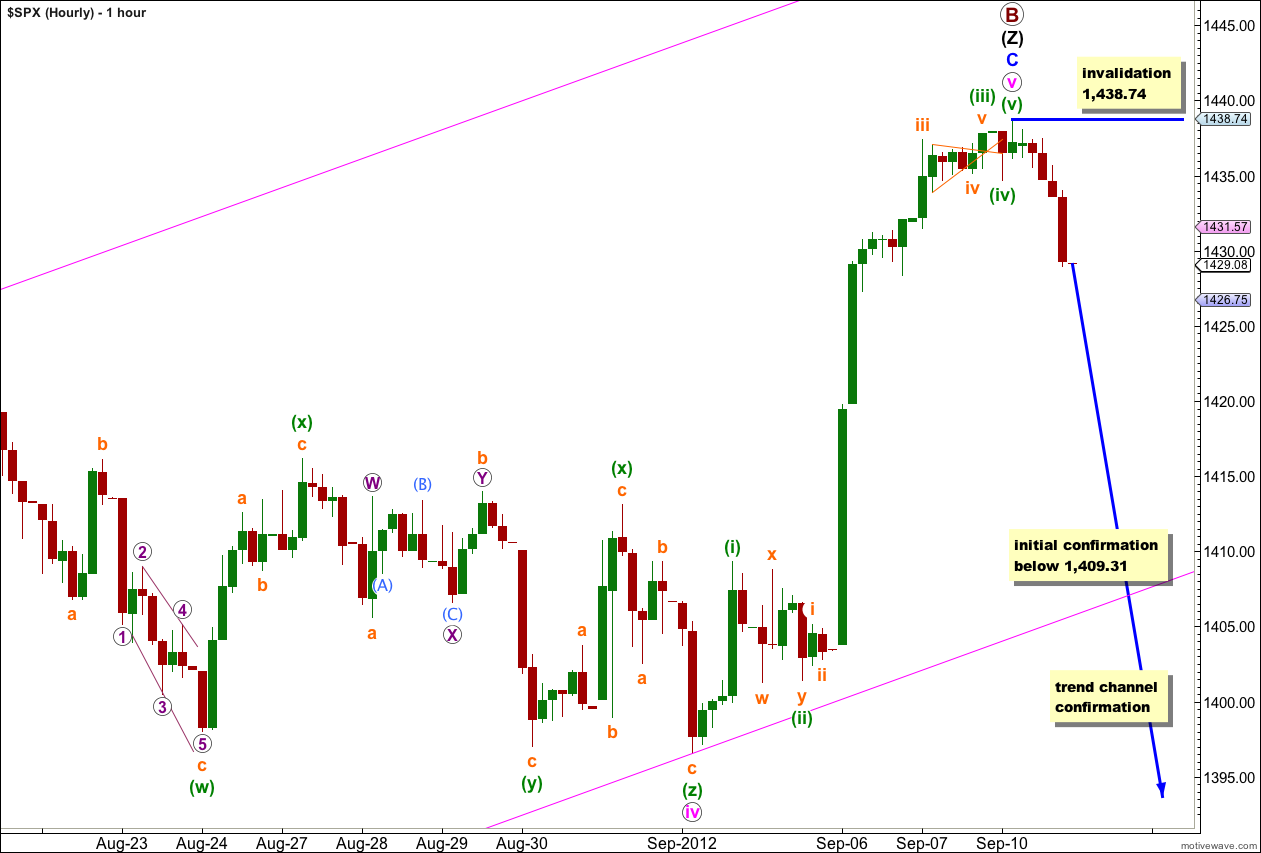
It is possible that we have a high in place at 1,438.74, 2.26 points below the target zone.
We shall have zero confirmation of this though while price remains above 1,409.31.
If this wave count is correct then we may see strong downwards momentum this week. If price does not break below 1,409.31 this week then the probability of this wave count will be reduced.
Ratios within wave C blue are: wave iii pink has no Fibonacci ratio to wave i pink, and wave v pink is 2.7 points longer than 0.618 the length of wave i pink.
Ratios within wave v pink are: wave (iii) green is 3.04 points longer than 2.618 the length of wave (i) green, and wave (v) green is 0.81 points short of 0.382 the length of wave (i) green.
Ratios within wave (iii) green are: wave iii orange has no Fibonacci ratio to wave i orange, and wave v orange is 0.31 points short of 0.618 the length of wave i orange.
The very first thing to look out for is a clear five down on the hourly chart. That would be a good indication of a trend change.
Movement below the parallel channel on this hourly chart would be further indication of a trend change.
Movement below 1,409.31 would invalidate the alternate hourly chart below and would be further confirmation of a trend change.
Finally, movement below the parallel channel on the daily chart would provide confidence in a trend change.
Within the new downwards movement no second wave correction may move beyond the start of the first wave. This wave count is invalidated with movement above 1,438.74.
If this wave count is invalidated this week with upwards movement then we shall use the alternate wave count below.
Alternate Hourly Wave Count.
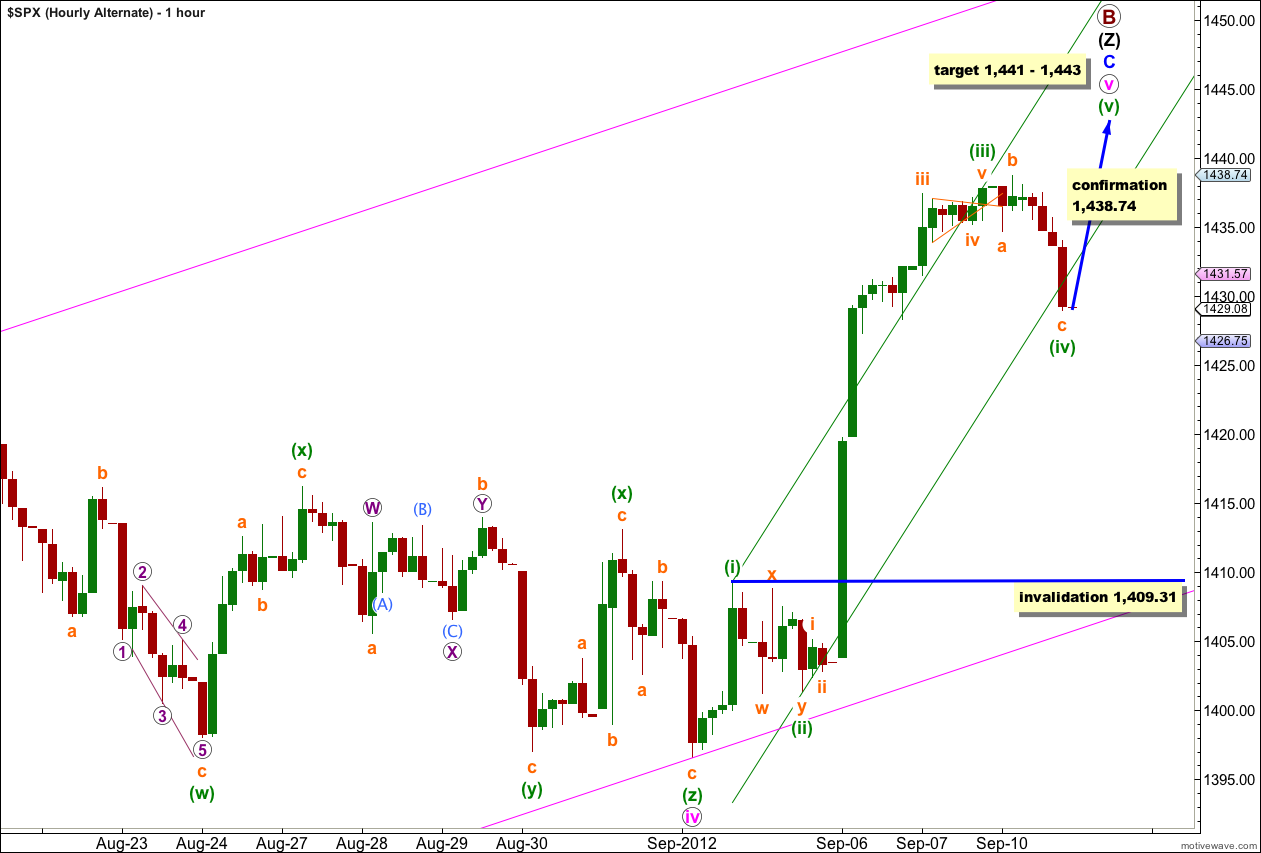
With a small adjustment in most recent movement as a flat correction it is possible that downwards movement for Monday’s session is a fourth wave.
This alternate differs from the main in how it sees the upwards movement labeled b orange within wave (iv) green, the very last piece of upwards movement. The main wave count has to see that as a five, this alternate sees it as a three. When the subdivision of this movement is viewed carefully on the 5 and 1 minute charts it looks most like a three. For this reason I consider this alternate wave count to have a good probability.
While price remains above 1,409.31 we must seriously consider this wave count.
I have used Elliott’s technique to draw a parallel channel about the upwards movement of wave v pink. The first trend line is drawn from the high of waves (i) to (iii), then a parallel copy is placed upon the low of (ii) green. There is a small fourth wave overshoot so it may be that we see wave (v) green overshoot on the opposite side. Wave (v) green may also end mid way in the channel, particularly if the target is correct.
At 1,443 wave C blue would reach equality in length with wave A blue.
At 1,441 wave v pink would reach 0.618 the length of wave iii pink.
Wave (iv) green may not move into wave (i) green price territory. This wave count is invalidated with movement below 1,409.31.