
Last analysis expected upwards movement to a target at 13,199 to 13,220. The Dow has moved higher last week comfortably passing the target, but remaining below the invalidation point on the hourly chart.
I have a main daily wave count with an hourly chart and an alternate which may be used if the main wave count is invalidated.
Click on the charts below to enlarge.
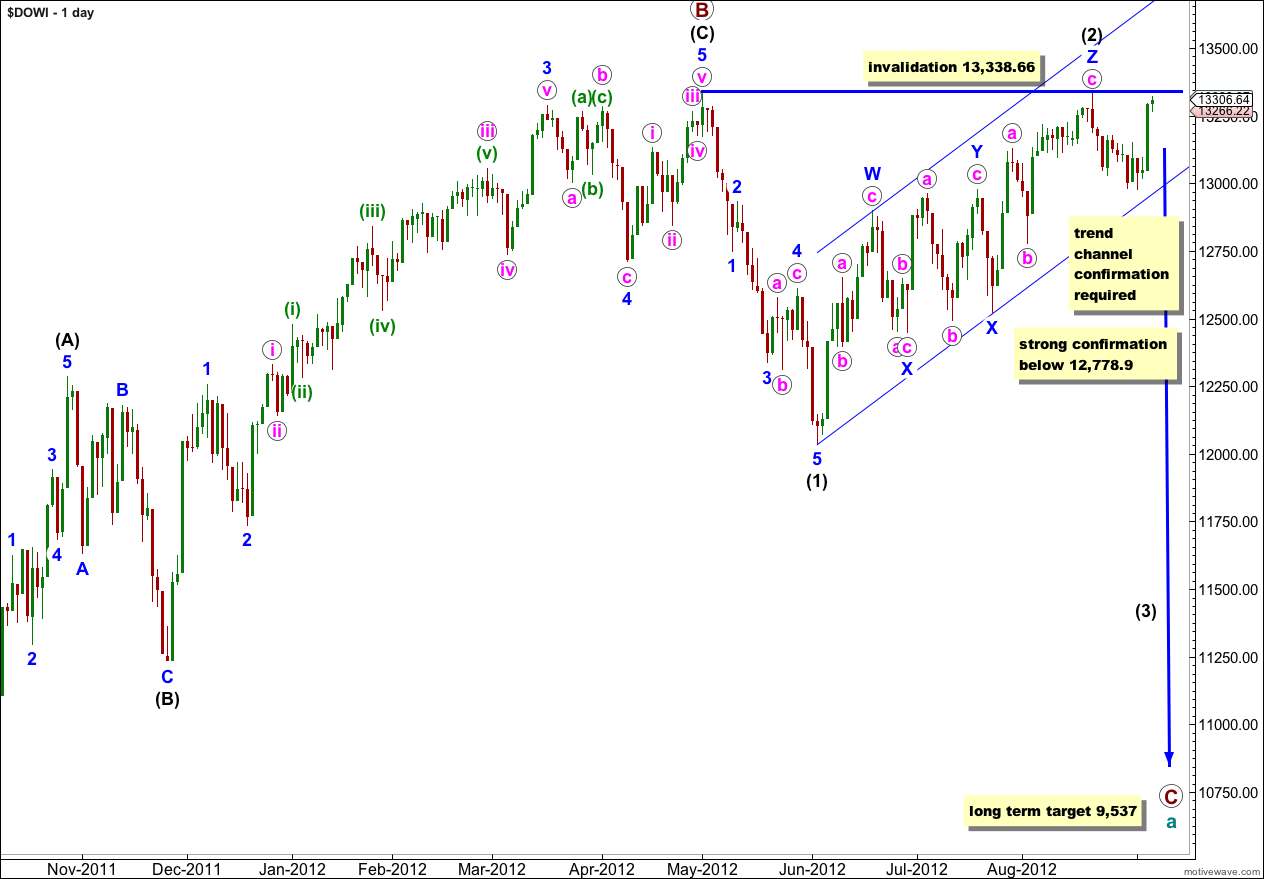
Wave (2) black may have ended as a very rare triple zigzag. The subdivisions all fit and the purpose of a triple zigzag to deepen a correction is being achieved; movement is clearly upwards and not sideways.
Cycle wave a is an expanded flat because primary wave B within it is over 105% the length of primary wave A. An expanded flat expects a C wave to move substantially beyond the end of the A wave. At 9,537 primary wave C would achieve this and would be a typical 1.618 the length of primary wave A.
The parallel channel drawn here about wave (2) black is a best fit. Movement below this channel would confirm a trend change.
Wave (2) black may not move beyond the start of wave (1) black. This wave count is invalidated with movement above 13,338.66.
If this wave count is invalidated with movement above 13,338.66 we should use the alternate daily wave count.
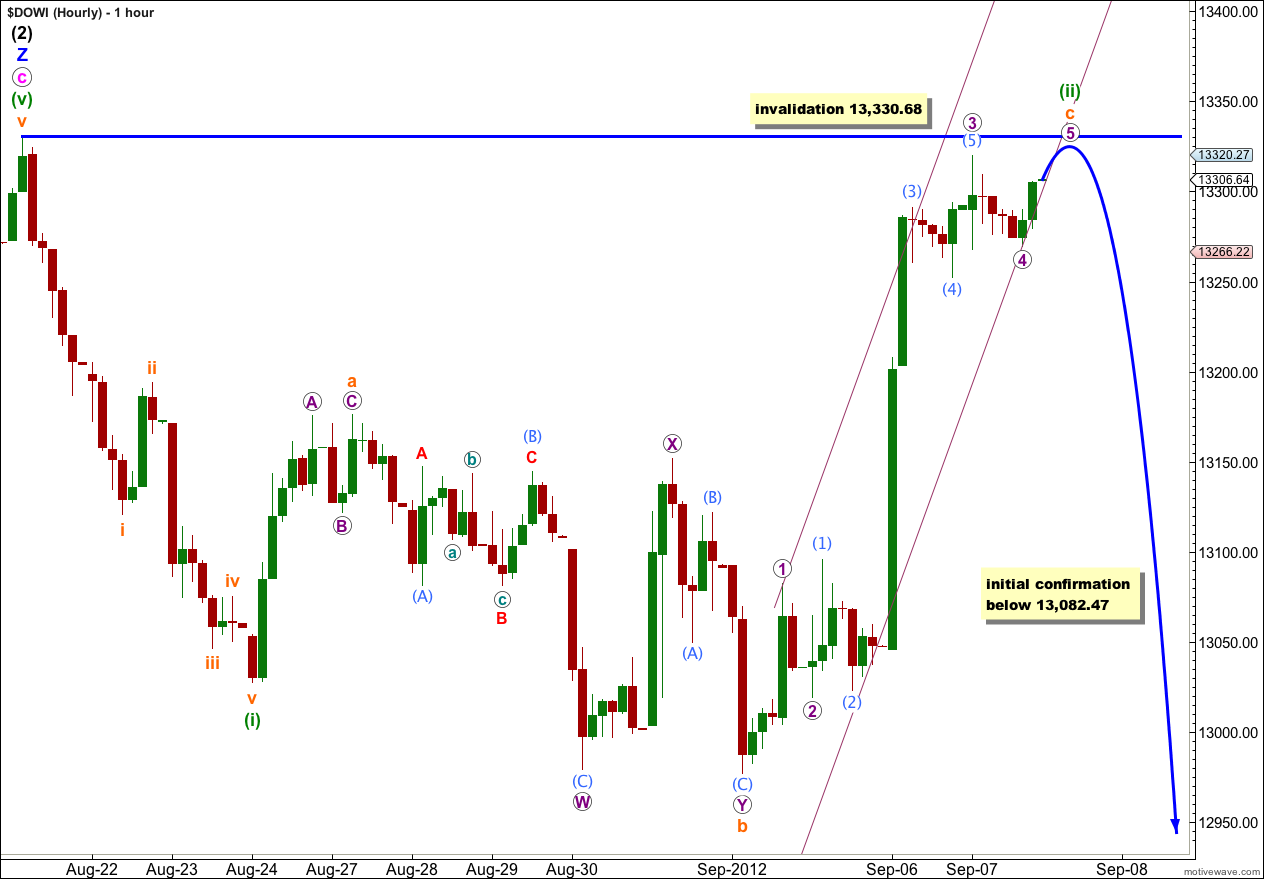
Within the flat correction of wave (ii) green wave b orange began the week with slightly lower movement to complete a double zigzag. Wave b orange is now a 134% correction of wave a orange which is within the normal expectation for wave B within a flat correction.
Within wave c orange the structure is still incomplete. It may complete early in Monday’s trading session with a final fifth wave.
I expect price may get extremely close to the invalidation point at 13,330.68. Wave (ii) green may be a 100% correction of wave (i) green and only movement ABOVE 13,330.68 would invalidate the wave count. This invalidation point is black and white. Even a fraction of a point above this would invalidate the wave count. At that stage we may use the alternate below.
If this wave count remains valid and we see a trend change during Monday’s session then price movement below 13,082.47 would provide initial indication that we may be seeing wave (iii) green downwards. At that stage price would be back in wave 1 purple price territory, and downwards movement could not be a fourth wave correction and wave c orange would have to be over. At that stage we should expect an increase in strong downwards momentum.
I am expecting wave (iii) green to begin early in Monday’s session and to see an increase in downwards momentum next week.
If price moves above 13,330.68 then we should use the alternate daily wave count below.
Alternate Daily Wave Count.
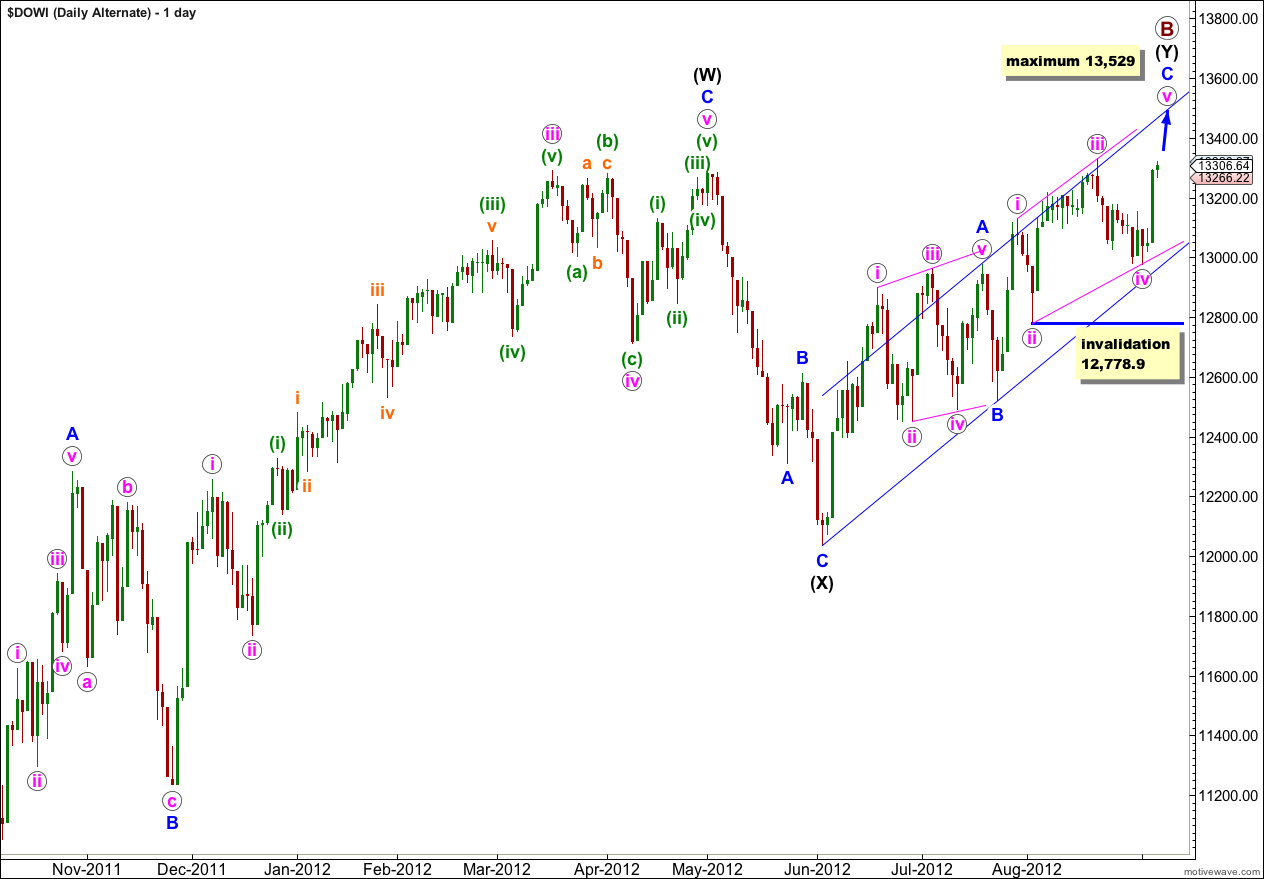
It is possible to see waves i and iii pink within wave C blue as zigzags, although this does not have as good a fit as the main wave count. This alternate has a lower probability.
Wave C blue may be unfolding as an imperfect ending diagonal because the wave lengths are not as expected. Wave iii pink is shorter than wave i pink and the diagonal should be contracting, but wave iv pink is longer than wave ii pink. This reduces the probability of this wave count.
Also, wave iv pink continued sideways during last week’s trading. It does not now subdivide neatly into a zigzag and this further reduces the probability of this wave count.
Because wave iii pink is shorter than wave i pink there is a maximum length for wave v pink. It may not be longer than the third wave. The maximum length is achieved at equality with wave iii pink at 13,529.
Within a diagonal wave iv pink may not move beyond the end of wave ii pink. This structure is invalidated with movement below 12,778.9.
Movement below 12,778.9 would provide strong confirmation for the main daily wave count and a trend change at primary degree. It should also bring price below the parallel channel here on the daily chart, providing further confidence to a trend change.