
S&P 500 price movement below 1,397.01 invalidated the hourly wave count by a fraction of a point, but the daily wave count remains valid.
I have still the same daily wave count and an hourly wave count which is very similar to last analysis.
Click on the charts below to enlarge.
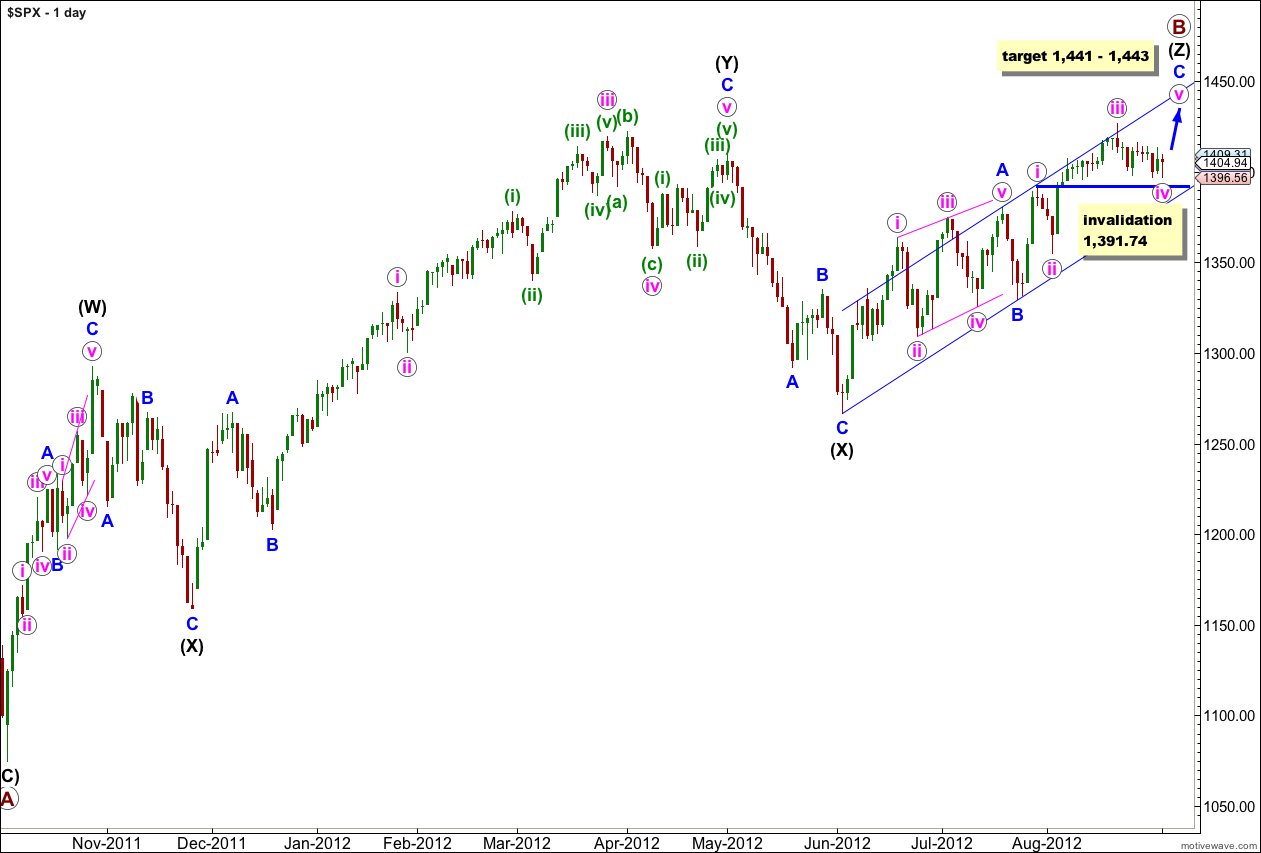
This upwards movement (from the low labeled primary wave A) has a lot of overlapping three wave structures within it. Because the upwards wave labeled intermediate (black) (W) can only be seen as a three wave structure, the only structure that fits for this entire movement within this wave count is a triple zigzag.
The only other Elliott wave structure which has these subdivisions is a leading (or ending) diagonal. This would fit within the second alternate monthly wave count which may be found here. It could also possibly fit as an ending diagonal for the first monthly alternate, the expanding triangle scenario.
Within wave (Z) black wave A blue was a leading contracting diagonal. Wave B blue was a brief zigzag. Wave C blue is exhibiting alternation with wave A blue and unfolding as an impulse.
When the parallel channel about wave (Z) black is clearly breached by downwards movement then we shall have confirmation of a trend change.
Within wave C blue wave iv pink may not move into wave i pink price territory. This wave count is invalidated with movement below 1,391.74.
If price moves below 1,391.74 then the structure within wave C blue must be complete and it would be highly likely that wave Z black would be complete. A triple is the maximum number of corrective structures within a multiple. When the third structure is over the entire correction must be over and there is no way it can continue further.
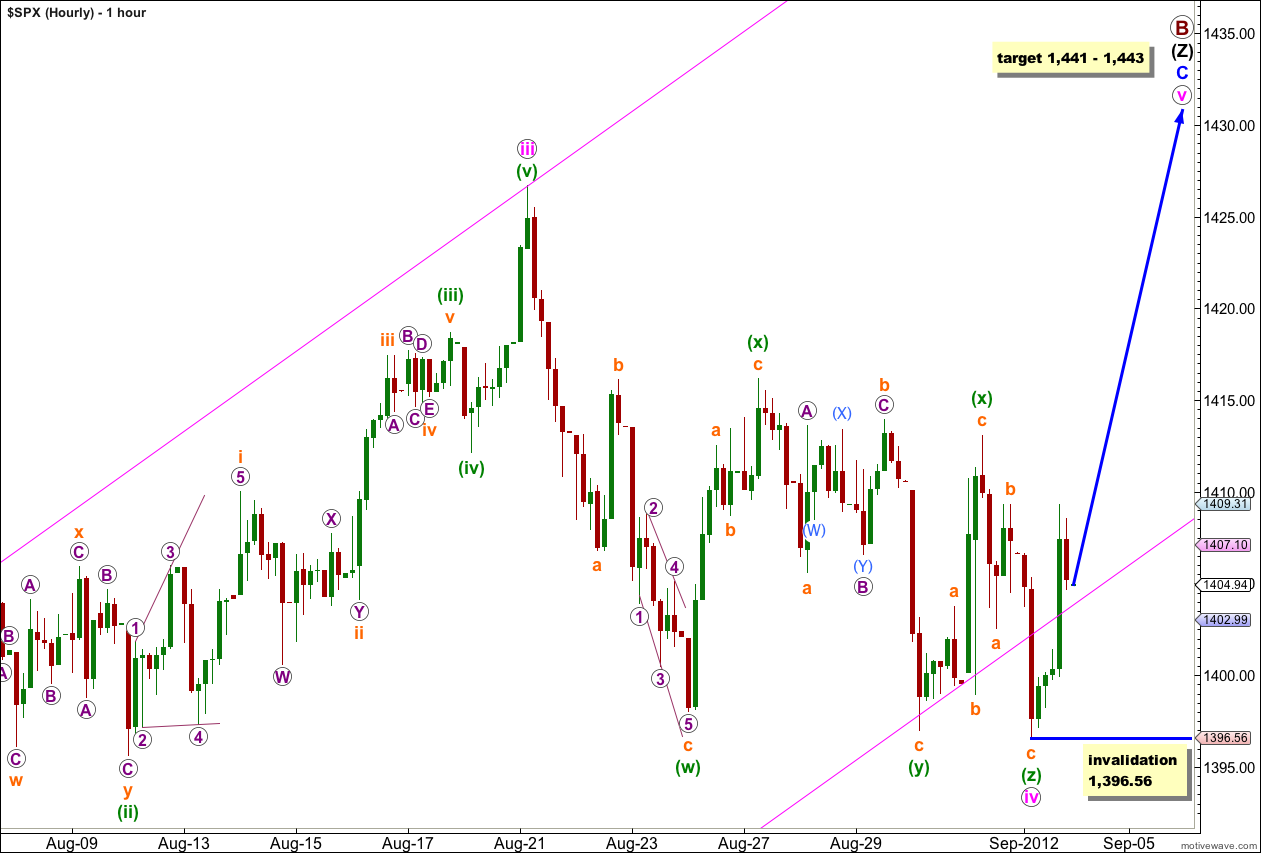
With movement very slightly below 1,397.01 wave iv pink must have extended sideways. The only fit for this structure, if it is a correction, is a rare triple zigzag.
The other structure which could fit (if there is a high in place and a big trend change at the high of 1,426.68 labeled iii pink) is a leading diagonal. I would consider this possibility if we see movement below 1,391.74.
At 1,441 wave v pink would reach 0.618 the length of wave iii pink. At 1,443 wave C blue would reach equality in length with wave A blue. This gives us a slightly wider 2 point target zone for one more final upwards wave.
Wave i pink lasted 4 sessions. Wave iii pink lasted 13 sessions. I would expect wave v pink to last between 4 and 13 sessions, with an emphasis on a longer duration because I would expect momentum to be slow.
Wave iv pink has moved price outside the parallel channel drawn using Elliott’s first technique about the impulse of wave C blue. This is okay, fourth waves are often but not always contained within these channels. When they overshoot the channel like this then the following fifth wave may overshoot the channel on the opposite side.
Within wave v pink no second wave correction may move beyond the start of the first wave. This wave count is invalidated with movement below 1,396.56.
If my analysis of the subdivisions within wave iv pink is correct then it must be over at this stage, because three corrective structures is the maximum possible within a multiple for a correction. Any further movement below 1,396.56 would put considerable doubt on this wave count. I would consider a trend change then more likely.