
The S&P 500 moved a little lower to start the session which is what the main wave count (and the hourly alternate) expected. Thereafter, price moved a little higher to see mostly overall sideways movement for this session.
The sole daily chart for this analysis has the same target. I have three alternate hourly charts today, with the first two charts expecting mostly the same movement for the next couple of sessions, or so, and only the duration differs.
Click on the charts below to enlarge.
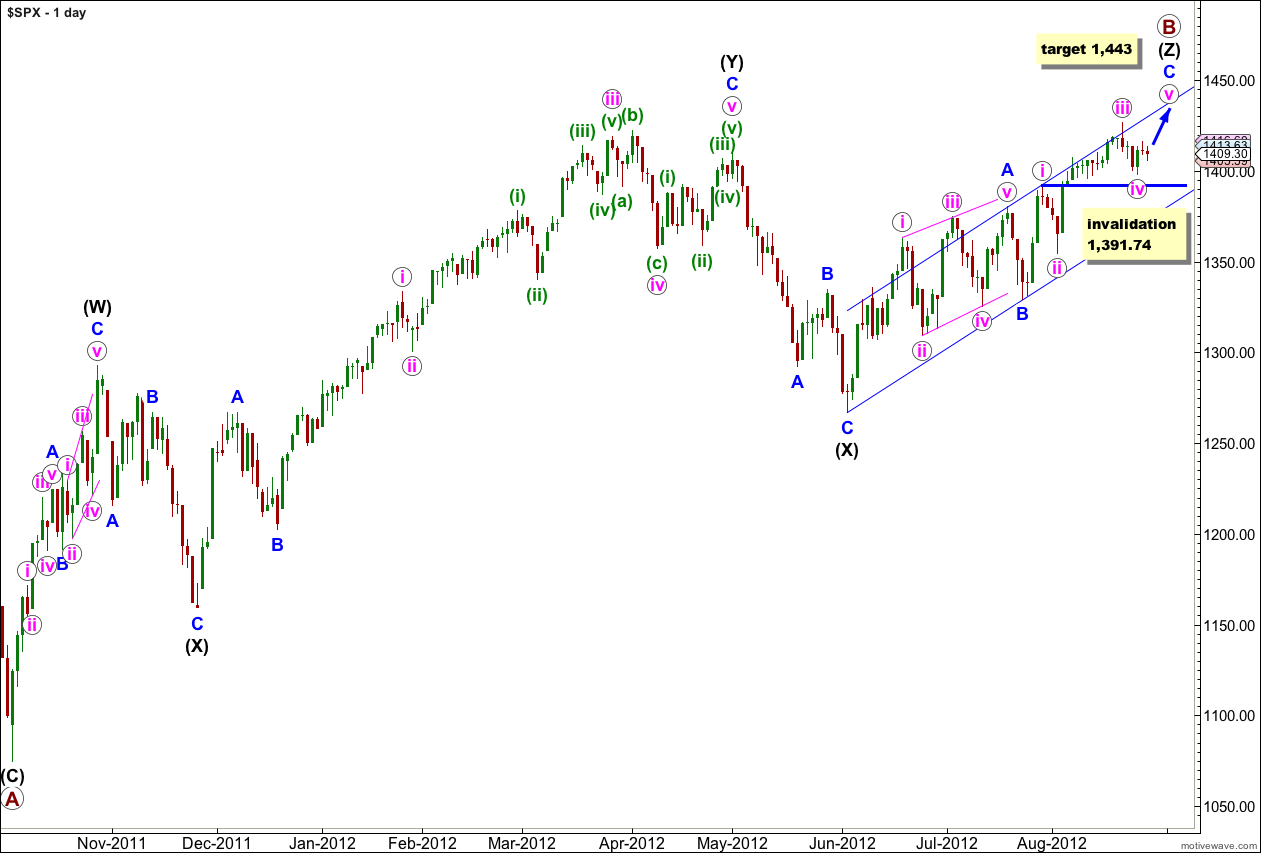
This upwards movement (from the low labeled primary wave A) has a lot of overlapping three wave structures within it. Because the upwards wave labeled intermediate (black) (W) can only be seen as a three wave structure, the only structure that fits for this entire movement within this wave count is a triple zigzag.
The only other Elliott wave structure which has these subdivisions is a leading (or ending) diagonal. This would fit within the second alternate monthly wave count which may be found here. It could also possibly fit as an ending diagonal for the first monthly alternate, the expanding triangle scenario.
Within wave (Z) black wave A blue was a leading contracting diagonal. Wave B blue was a brief zigzag. Wave C blue is exhibiting alternation with wave A blue and unfolding as an impulse.
When the parallel channel about wave (Z) black is clearly breached by downwards movement then we shall have confirmation of a trend change.
Within wave C blue wave iv pink may not move into wave i pink price territory. This wave count is invalidated with movement below 1,391.74. If this wave count is invalidated with downwards movement then I would consider the possibility that we may have seen a trend change and the end of primary wave B.
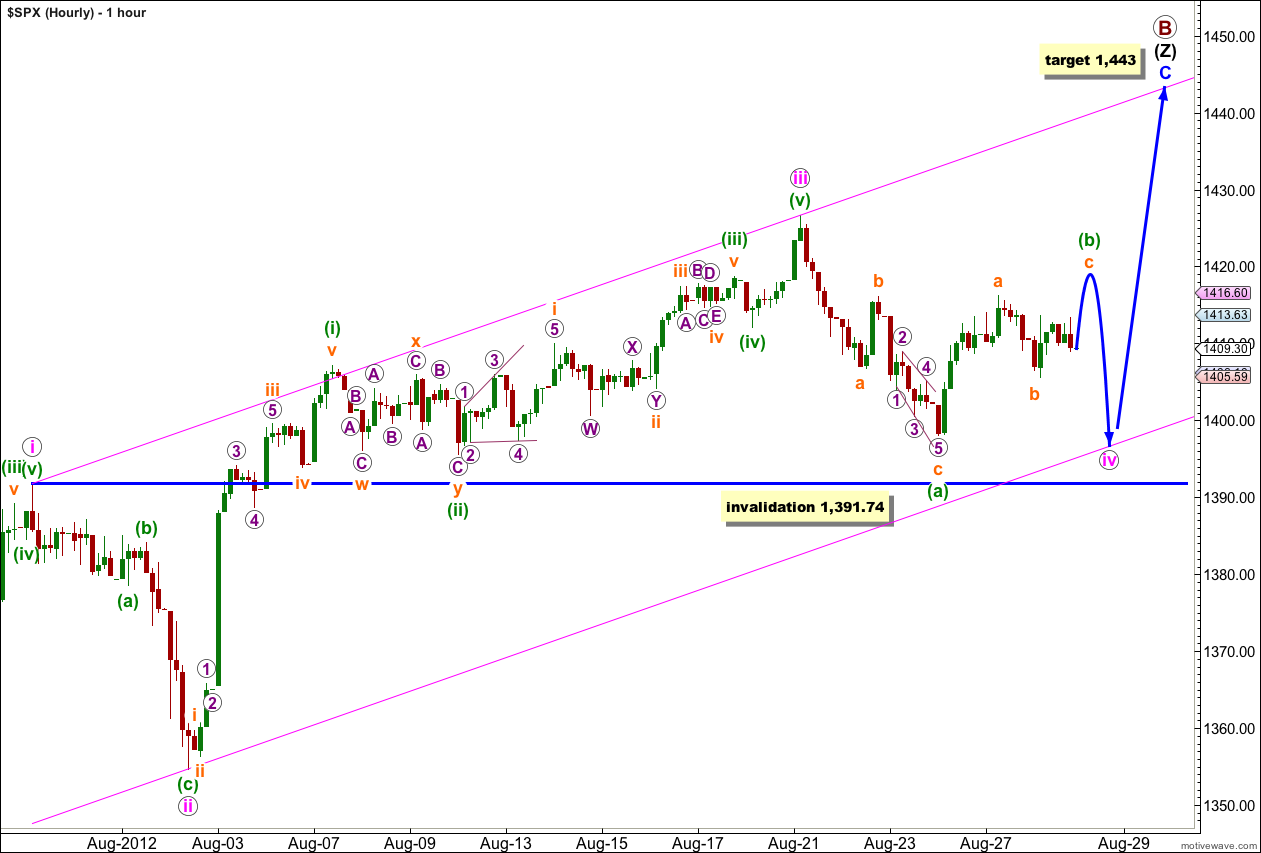
At this stage it is more likely that wave iv pink is not over. It may still be moving sideways in a slow moving flat correction, or it may be a double combination.
This wave count could be labeled two ways: as green (a), (b) and (c) for a flat correction, or as green (w), (x) and (y) for a double combination. Both sets of labels expect the same direction of movement next and it is only the subdivisions of the final downwards wave which differ.
If wave iv pink is a flat correction then wave (b) green must be at least 90% the length of wave (a) green. This is achieved at 1,424.
If wave iv pink is a double combination correction then wave (x) green does not have a minimum required length and must subdivide into a three.
When the upwards zigzag for wave (b) or (x) green is complete then we should expect a downwards wave for wave (c) or (y) green. This downwards movement is likely to make a new low below the end of wave (a) green at 1,398.04 and may find support at the lower edge of the parallel channel.
This wave count expects overall more sideways movement for another one or two sessions.
Thereafter, wave v pink is likely to make new highs. The target at 1,443 is where wave C blue would reach equality with wave A blue.
Wave iv pink may not move into wave i pink price territory. This wave count is invalidated with movement below 1,391.74.
Alternate Hourly Chart
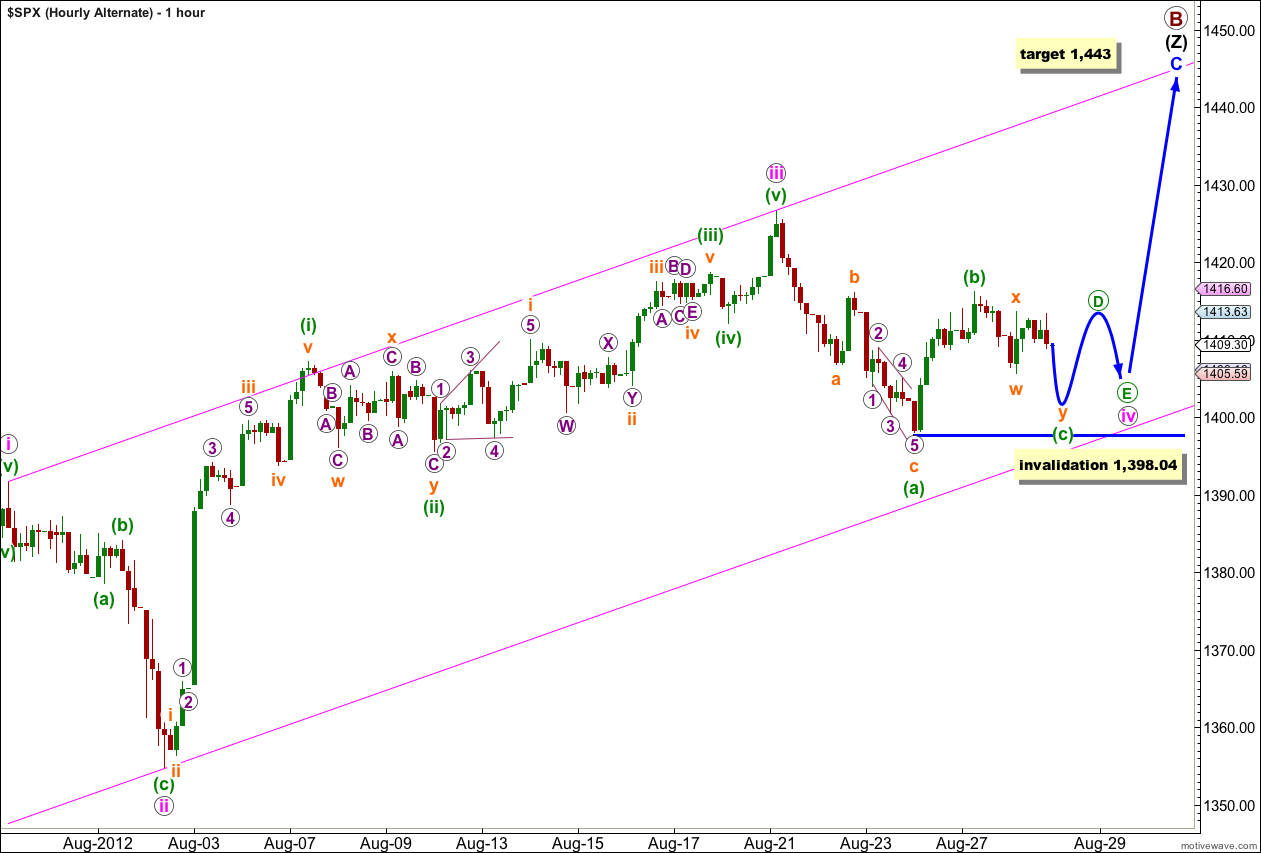
It is possible that wave iv pink is unfolding as a time consuming and sideways moving contracting triangle.
Within a triangle one of the subwaves is usually longer lasting and more complicated than the others. This is often wave C.
Here wave (c) green may be subdividing as a double zigzag. This fits nicely with the upwards movement labeled wave x orange within (c) green subdividing as a zigzag on the 5 minute and 1 minute charts.
To the downside wave (c) green may not move beyond the end of wave (a) green. This triangle is invalidated with movement below 1,398.04.
To the upside if I have the end of wave (b) green labeled correctly as complete then wave (d) green should not move much if at all above the end of wave (b) green at 1,416.17 (if the triangle is a barrier triangle then wave D may move very slightly beyond the end of wave B, as long as the B-D trend line is essentially flat).
This wave count expects choppy, overlapping and sideways movement for another two to four sessions. I would expect it to take its time so I favour the higher end of this estimate.
For this wave count it looks likely that wave iv pink would be contained within this parallel channel as the lower edge should provide support.
Thereafter, a final thrust upwards for wave v pink would be expected.
Wave iv pink may not move into wave i pink price territory. This wave count is invalidated with movement below 1,391.74.
Second Alternate Hourly Chart
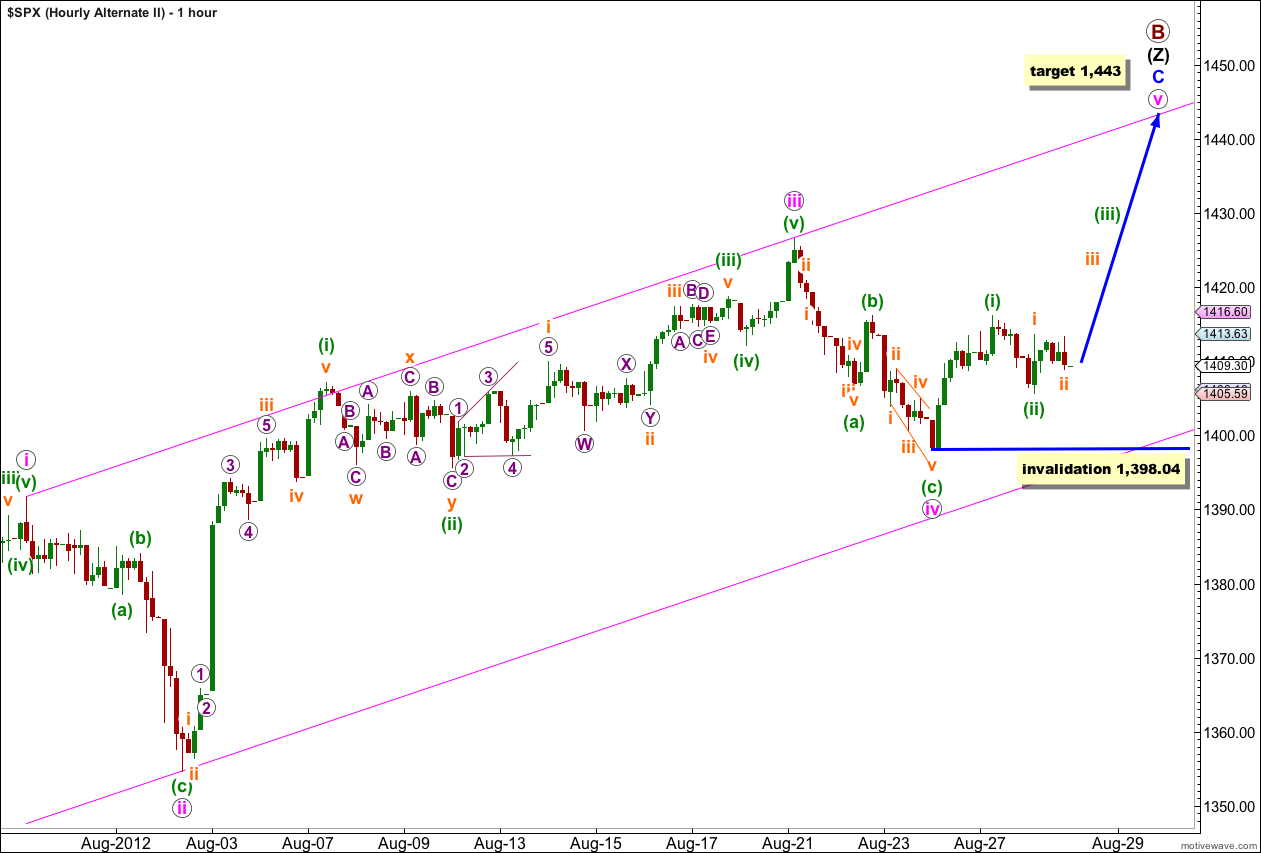
At this stage it is still possible that wave (iii) green has now begun. It is common within third waves for each subdivision to be clear on the hourly chart, and so we may have seen waves i and ii orange complete at the end of Tuesday’s session.
However, when I look at the 5 minute chart to see if wave i orange subdivides into a five it does not. This movement subdivides more easily into a zigzag. For this reason this wave count is today an alternate. Considering recent movement over the last two sessions I think this wave count has the lowest probability today of the three hourly wave counts.
If price moves higher with a clear increase in momentum tomorrow then this wave count may be a good explanation.
Any further extension downwards of wave (ii) green may not move beyond the start of wave (i) green. This wave count is invalidated with movement below 1,398.04.