
The S&P 500 moved overall higher during Friday’s session, which is what the last analysis expected.
I have just the one daily wave count, with two hourly wave counts. Both hourly wave counts expect the same direction for Monday’s session.
Click on the charts below to enlarge.
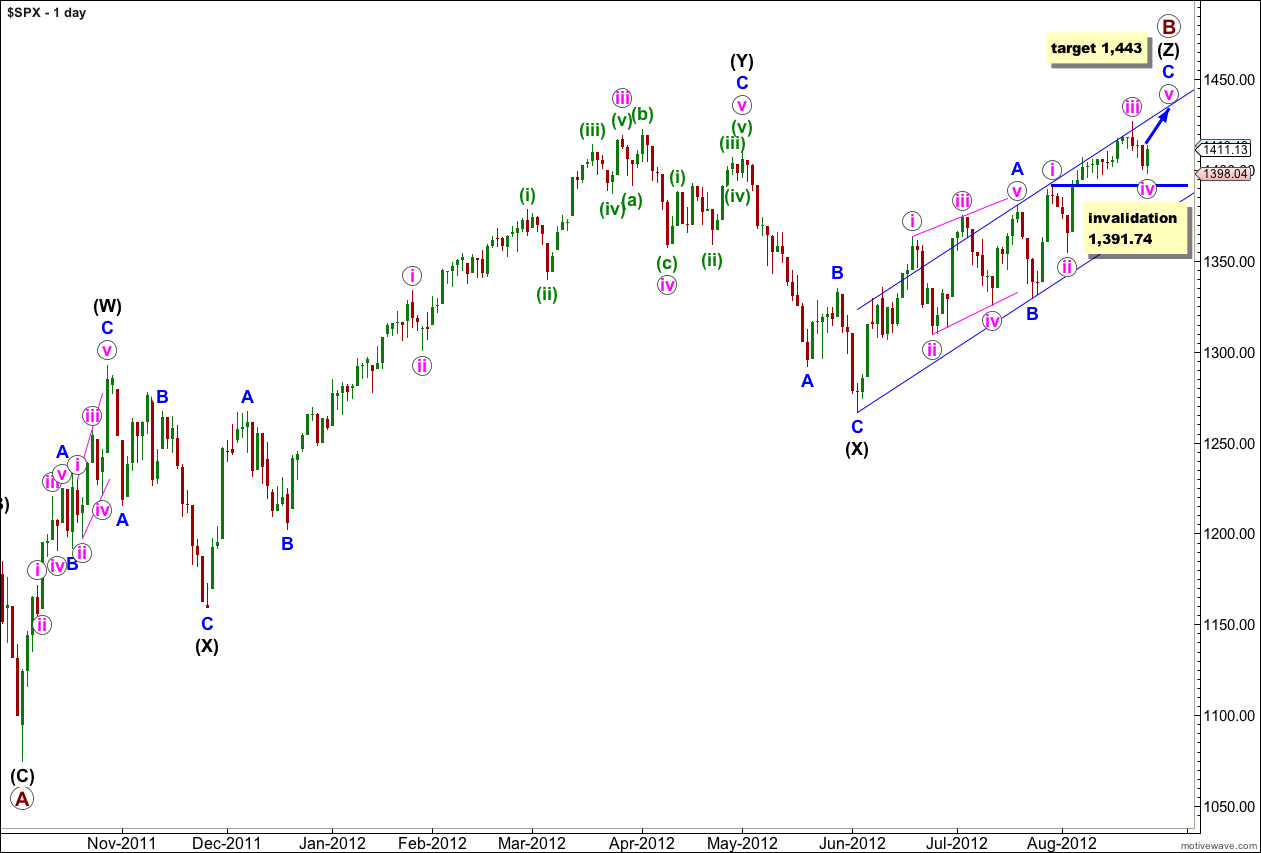
I have zoomed out today to show the entirety of primary wave B triple zigzag.
This upwards movement has a lot of overlapping three wave structures within it. Because the upwards wave labeled intermediate (black) (W) can only be seen as a three wave structure, the only structure that fits for this entire movement within this wave count is a triple zigzag.
The only other Elliott wave structure which has these subdivisions is a leading (or ending) diagonal. This would fit within the second alternate monthly wave count which may be found here.
Price moved slightly lower before moving higher, and again has remained above 1,391.74. Wave iv pink has moved lower and is now nicely in proportion to wave ii pink in terms of duration. Wave ii pink was a deep 59% correction of wave i pink and, so far, wave iv pink is shallow 40% correction of wave iii pink.
Within wave (Z) black wave A blue was a leading contracting diagonal. Wave B blue was a brief zigzag. Wave C blue is exhibiting alternation with wave A blue and unfolding as an impulse.
When the parallel channel about wave (Z) black is clearly breached by downwards movement then we shall have confirmation of a trend change.
Within wave C blue wave iv pink may not move into wave i pink price territory. This wave count is invalidated with movement below 1,391.74. If this wave count is invalidated with downwards movement then we may consider the alternate hourly wave count below.
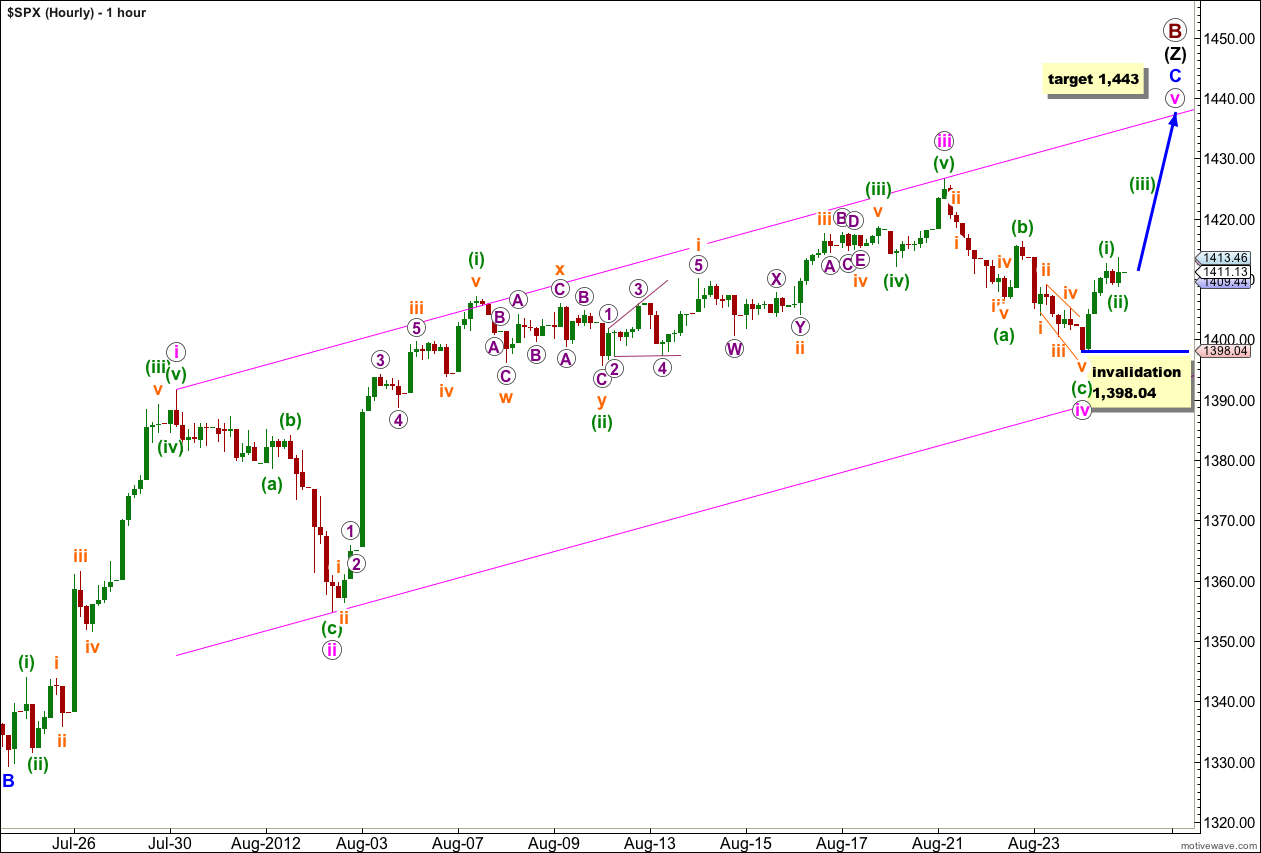
Wave iv pink may be a complete zigzag, with an impulse for wave (a) green and an ending diagonal for wave (c) green exhibiting perfect alternation. Wave (c) green is close to equality in length with wave (a) green, only 1.78 points shorter.
At 1,443 wave v pink would reach 0.618 the length of wave iii pink. Also now at 1,443 wave C blue would reach equality in length with wave A blue. This target has a good probability.
Wave v pink should find resistance at the upper edge of the parallel channel drawn here.
Wave ii pink lasted 3 sessions. So far wave iv pink has also lasted 3 sessions. It would be most likely that wave iv pink is equal in duration with wave ii pink and so this increases the probability that this main hourly wave count is correct.
Wave i pink lasted 4 sessions, wave iii pink lasted 13 sessions. Wave v pink may last about 4 to 13 sessions, and more likely to be at the upper end of this expectation as it should exhibit a slowing of momentum.
Any movement below 1,398.04 would invalidate this wave count as wave (ii) green may not move beyond the start of wave (i) green. If this wave count is invalidated then we should use the alternate hourly wave count below.
Alternate Hourly Wave Count.
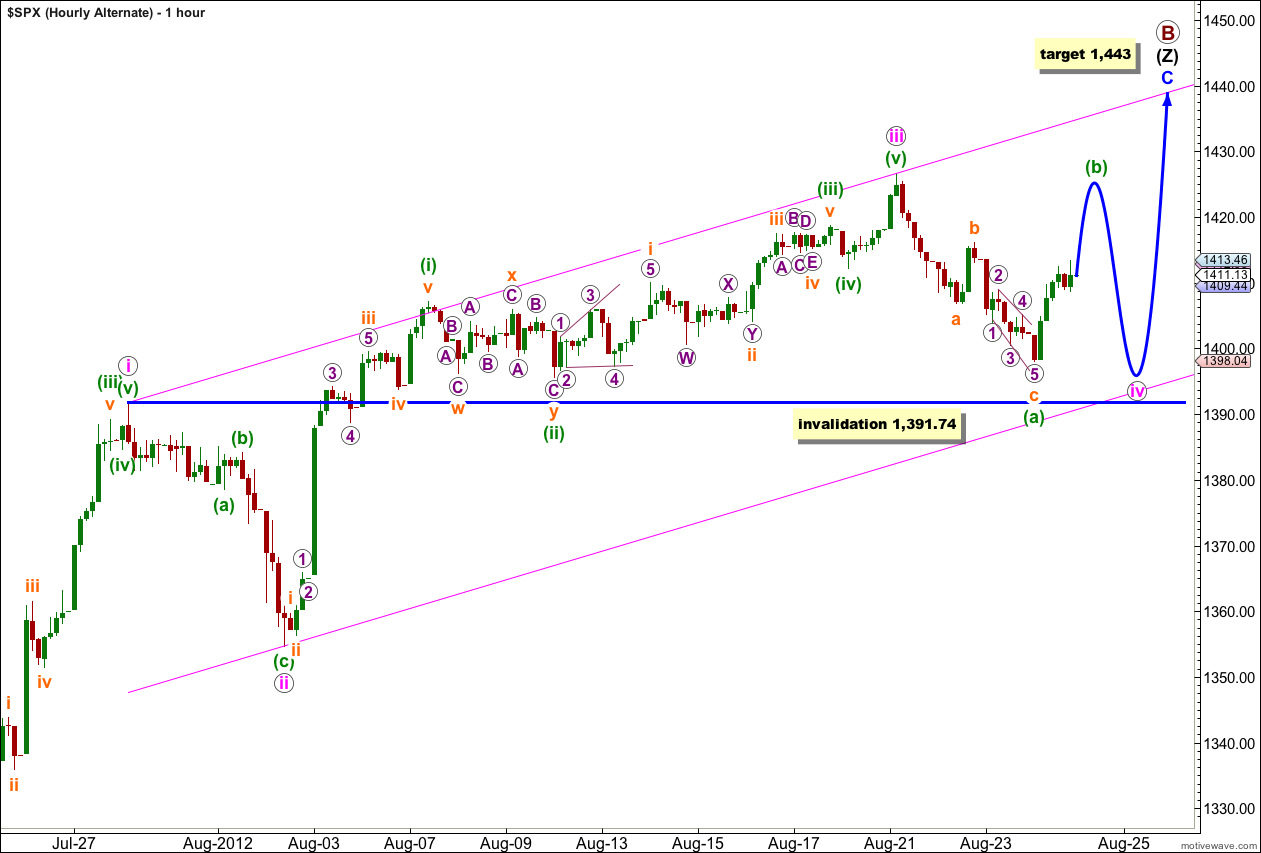
If we simply move the degree of labeling within wave iv pink down one degree we may have only seen wave (a) green complete.
Wave iv pink may continue further sideways as a flat, triangle or double.
If this wave count is correct then wave (b) green (or wave (x) green if wave iv pink is a double) should move higher during Monday’s session, and this alternate expects upwards movement as does the main hourly wave count.
For this alternate wave count the upwards movement should be a three wave structure.
When price reaches up to about 1,424 wave (b) green would be 90% the length of wave (a) green, which is the minimum length for a B wave within a flat correction. About that point we shall have to look at the structure of upwards movement very carefully. If it is a three then this alternate wave count would have the highest probability. However, if it is a five then the main hourly wave count would have the highest probability.
Wave iv pink may not move into wave i pink price territory. This wave count is invalidated with movement below 1,391.74.
If this wave count is invalidated I would consider the possibility that we may have seen the end to primary wave B and a big trend change may have occurred.