
The S&P 500 moved lower during Thursday’s session which was not the expected direction, but price remains well above the invalidation point on the hourly and daily charts.
I have still the one daily chart with an alternate monthly wave count should price continue higher.
I have two hourly wave counts looking at most recent movement differently.
Click on the charts below to enlarge.
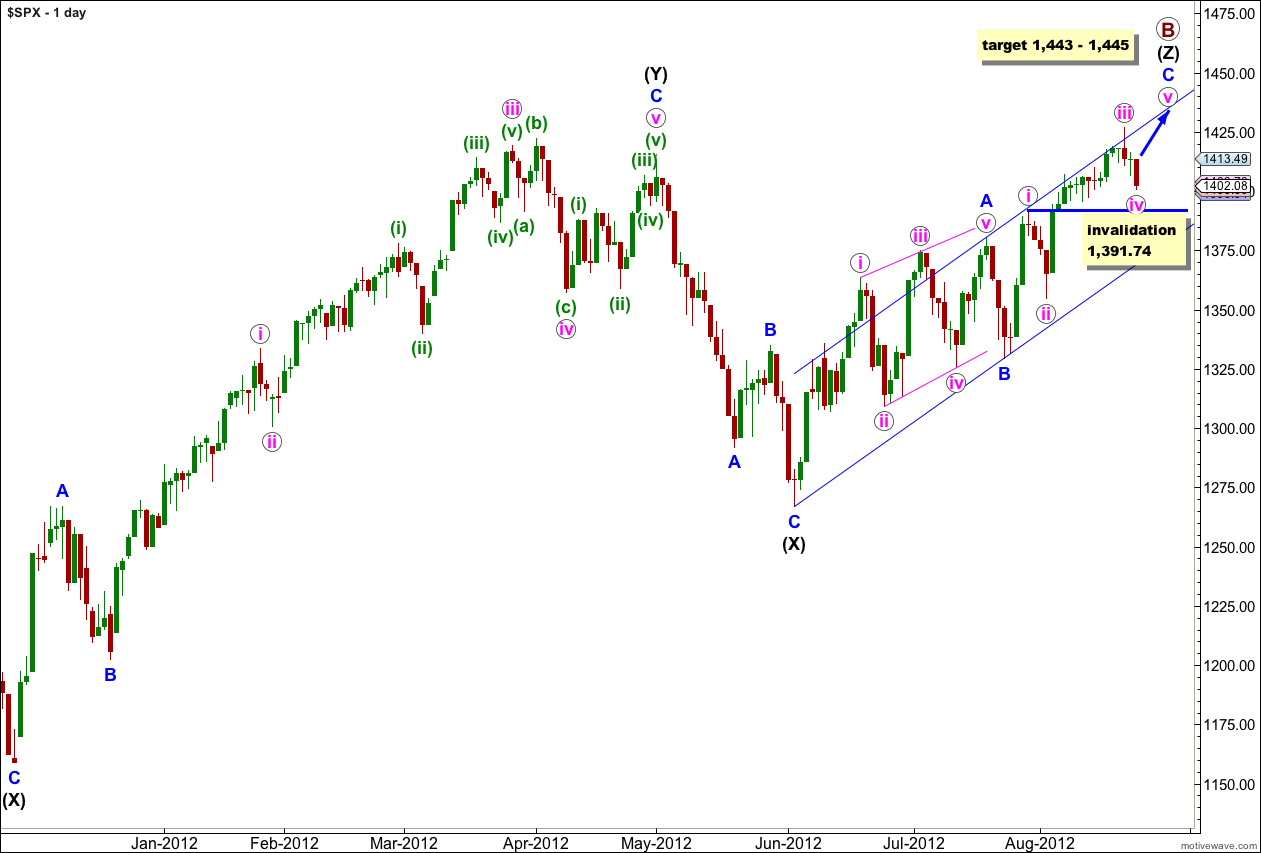
Price moved lower but has remained above 1,391.74. Wave iv pink has moved lower and is now more in proportion to wave ii pink in terms of duration. Wave ii pink was a deep 59% correction of wave i pink and, so far, wave iv pink is shallow 36% correction of wave iii pink.
Within wave (Z) black wave A blue was a leading contracting diagonal. Wave B blue was a brief zigzag. Wave C blue is exhibiting alternation with wave A blue and unfolding as an impulse.
When the parallel channel about wave (Z) black is clearly breached by downwards movement then we shall have confirmation of a trend change.
Within wave C blue wave iv pink may not move into wave i pink price territory. This wave count is invalidated with movement below 1,391.74. If this wave count is invalidated with downwards movement then we may consider the alternate hourly wave count below.
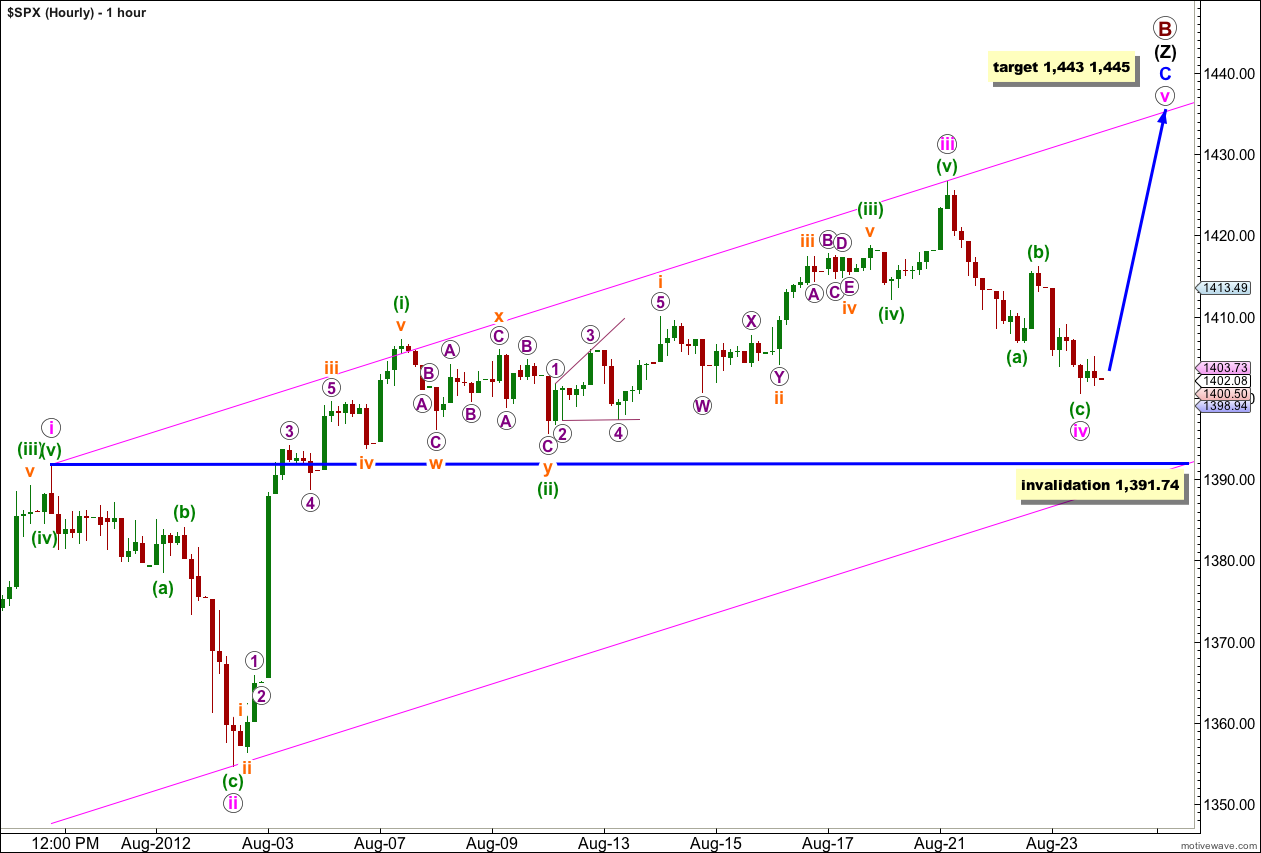
With price moving lower wave iv pink now has a better look as it is more in proportion to wave ii pink. If wave iv pink continues lower or sideways I would expect it to find support about the lower edge of this parallel channel.
There is no Fibonacci ratio between waves (a) and (c) green within wave iv pink.
At 1,445 wave v pink would reach 0.618 the length of wave iii pink. At 1,443 wave C blue would reach equality in length with wave A blue. This gives us a 2 point target zone for upwards movement to end.
At this stage there is excellent alternation in depth of correction between waves ii and iv pink, but no alternation in structure. For this reason I expect it is reasonably likely that wave iv pink may not be over and may continue further as a flat correction, triangle or double. If it does then it could exhibit perfect alternation with wave ii pink.
This main hourly wave count expects either upwards movement (if wave iv pink is indeed over) or mostly sideways movement for a few days while wave iv pink continues, before upwards movement.
If wave iv pink continues further then it may not move into wave i pink price territory. Movement below 1,391.74 would invalidate this wave count. At that stage we may more seriously consider the alternate below.
Alternate Hourly Wave Count.
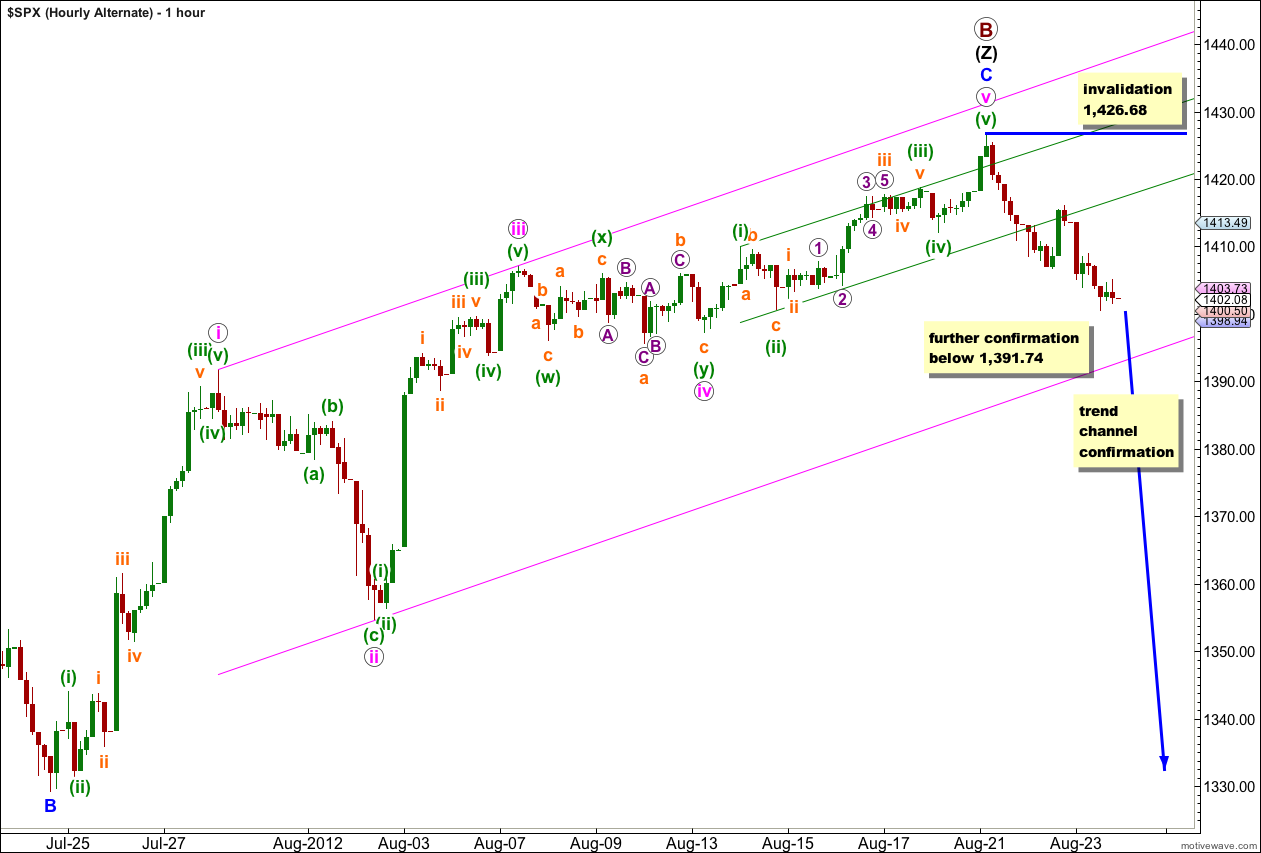
It remains possible that upwards movement is over. Within any trend there will always be several points along the way at which the structure could be considered complete at all wave degrees, but we should assume the trend remains the same, until proven otherwise. Therefore, we should assume the trend is up while price is above 1,391.74 and within the parallel channel on the daily and hourly charts.
If price begins to fall below 1,391.74 this alternate wave count would increase in probability. Movement below the channel would further increase the probability of a trend change.