
As expected from last analysis the S&P 500 moved higher during Friday’s session. Price remained comfortably above the invalidation point. Upwards movement has fallen short of the target by 2.29 points.
Monday’s session will be crucial. If the main wave count is invalidated I have two possible alternates which would explain why. I will cover both of these on daily and weekly charts in this end of week analysis. They both have low probabilities because they contain very rare structures.
Click on the charts below to enlarge.
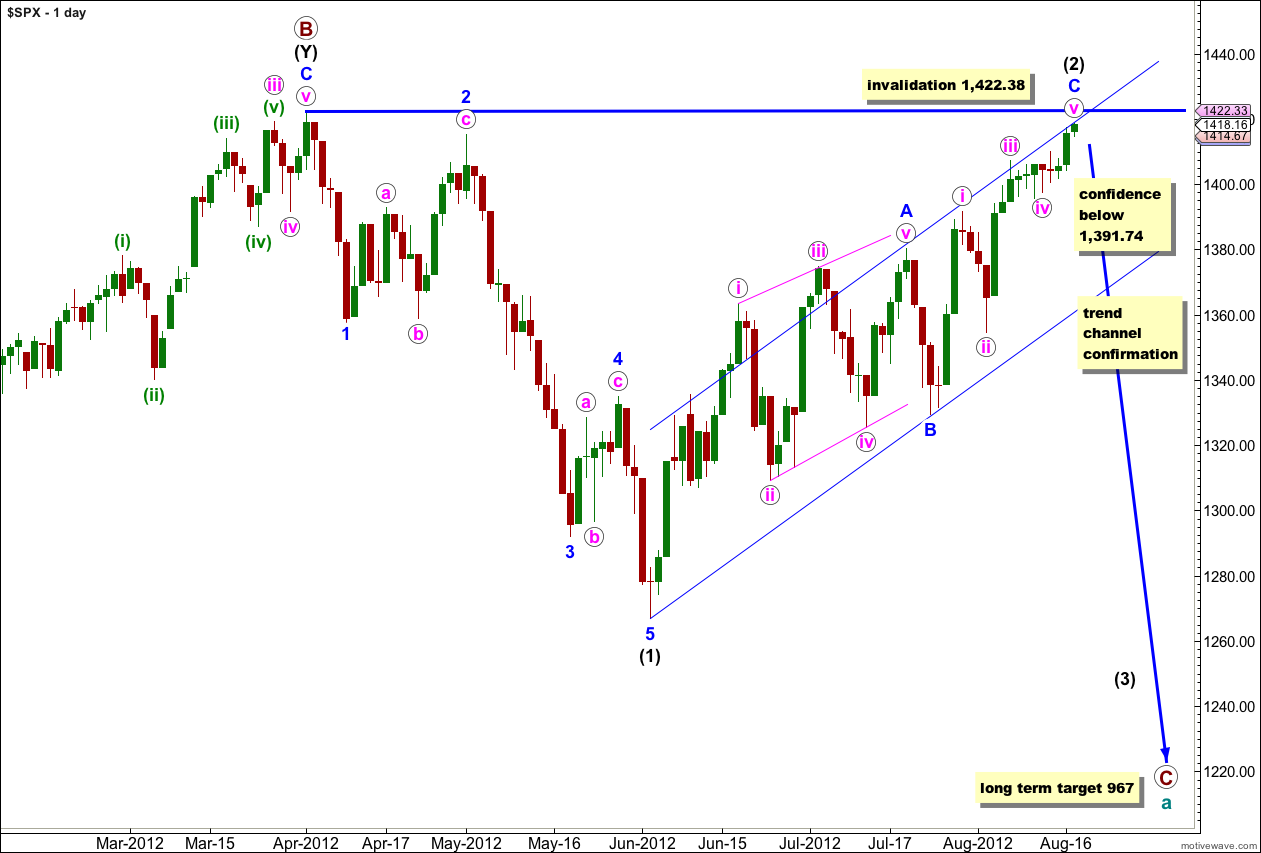
There is now almost no room left for upwards movement of wave (2) black. It is most likely over now and if price moves any higher during Monday’s session it should only be for a little while before a trend change. At this stage all structures at all wave degrees within wave (2) black can be seen as complete and this main wave count expects downwards movement to begin on Monday.
Wave (1) black was a clear five wave impulse downwards. Wave (2) black is here seen as a single very deep zigzag structure, with wave A blue a leading diagonal and wave C blue an impulse.
When the parallel channel drawn about wave (2) black using Elliott’s channeling technique is breached clearly be downwards movement then we shall have confirmation of a trend change at intermediate (black) degree. At that stage I will calculate a target for wave (3) black downwards for you. To do so now would be premature. At this stage we can know that if this next movement down is a third wave that it should exhibit strong momentum and must move price below the low labeled wave (1) black at 1,266.74.
Wave (2) black may not move beyond the start of wave (1) black. This wave count is invalidated with movement above 1,422.38.
If this wave count is invalidated on Monday with upwards movement then we shall use the two alternate scenarios below.
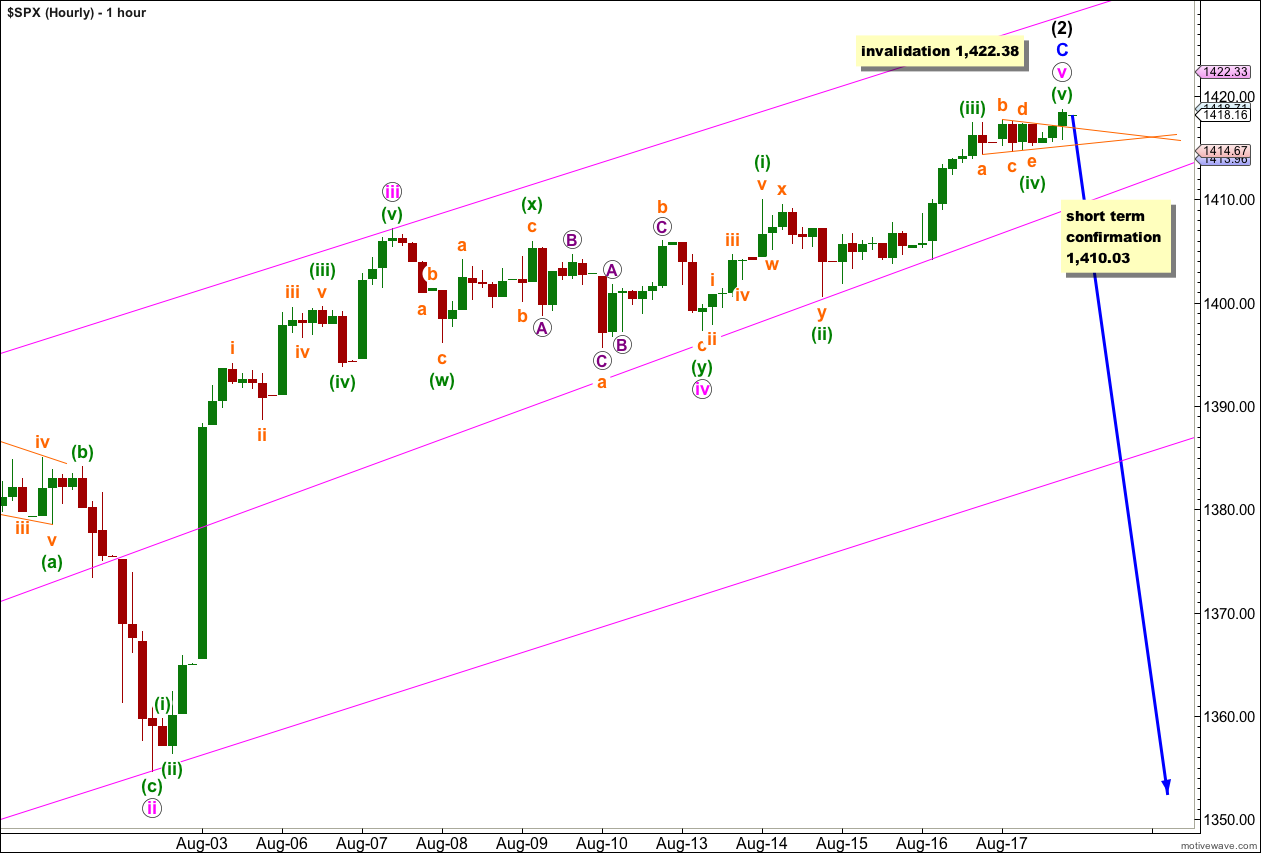
Friday’s sideways movement is a perfect contracting triangle for wave (iv) green. There is perfect alternation between waves (ii) and (iv) green.
There are no Fibonacci ratios between waves (i), (iii) and (v) green.
Ratios within wave C blue are: there is no Fibonacci ratio between waves i and iii pink, and wave v pink is 1.34 points longer than 0.382 the length of wave iii pink.
There is no Fibonacci ratio between waves A and C blue.
Movement below 1,410.03 would provide first indication of a trend change, at least at minute (pink) degree. At that stage the structure of wave v pink would have to be complete.
The double wide pink parallel channel is drawn here using Elliott’s channeling technique about the impulse for wave C blue. Draw the first line from the highs of wave i pink (seen on the daily chart) to iii pink, then place a parallel copy upon the low labeled ii pink. Create another parallel copy and place it close to the low of wave iv pink. When this channel is clearly breached by downwards movement we shall have an early indication of a trend change.
Alternate Daily Wave Count.
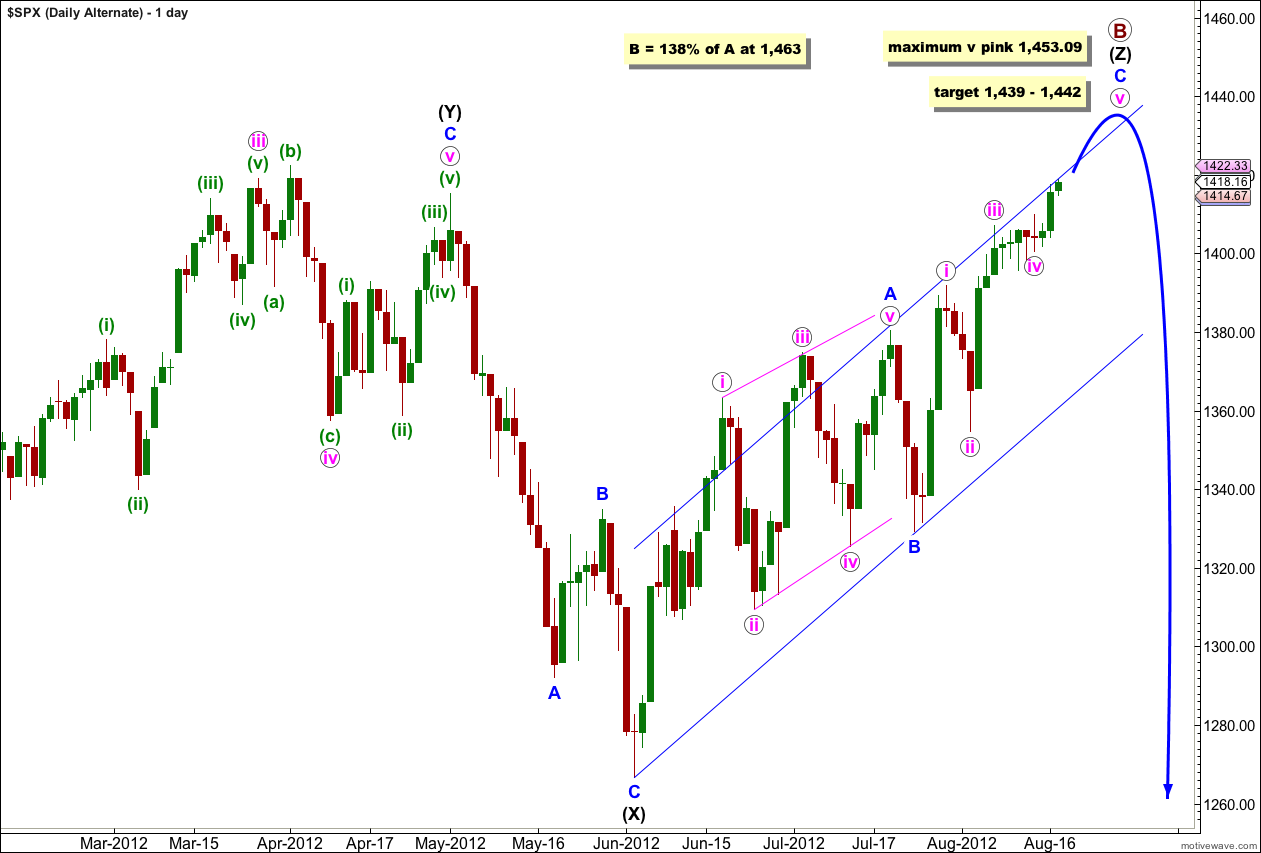
At the weekly chart level this alternate sees a cycle degree flat correction unfolding with primary A complete and primary B incomplete. The main wave count sees primary wave B as complete at the high of 1,422.38.
This alternate sees primary wave B unfolding as a very rare triple zigzag. The rarity of triples reduces the probability of this wave count significantly.
In order for this wave count to work the second zigzag in the triple labeled wave (Y) black must be seen as having a truncated fifth wave within wave C blue. The truncation here reduces the probability of this wave count a little further.
Wave (X) black here on this daily chart is the second X wave within the structure, joining the second and third zigzags in the triple.
Within the zigzag of wave (Z) black the structure is exactly the same as the main wave count. Wave A blue is a leading diagonal and wave C blue is a simple impulse.
Within wave C blue wave iii pink is shorter than wave i pink. This is important as it gives us a maximum expected limit to wave v pink. Since it cannot be longer than the third wave it reaches its maximum at equality with wave iii pink at 1,453.09.
At 1,439 wave v pink would reach 0.618 the length of wave i pink. At 1,442 wave C blue would reach equality with wave A blue. This gives us a three point target zone for upwards movement to end.
At 1,463 primary wave B would reach 138% the length of primary wave A. This is the maximum common length for a B wave within a flat correction.
Alternate Monthly Wave Count.
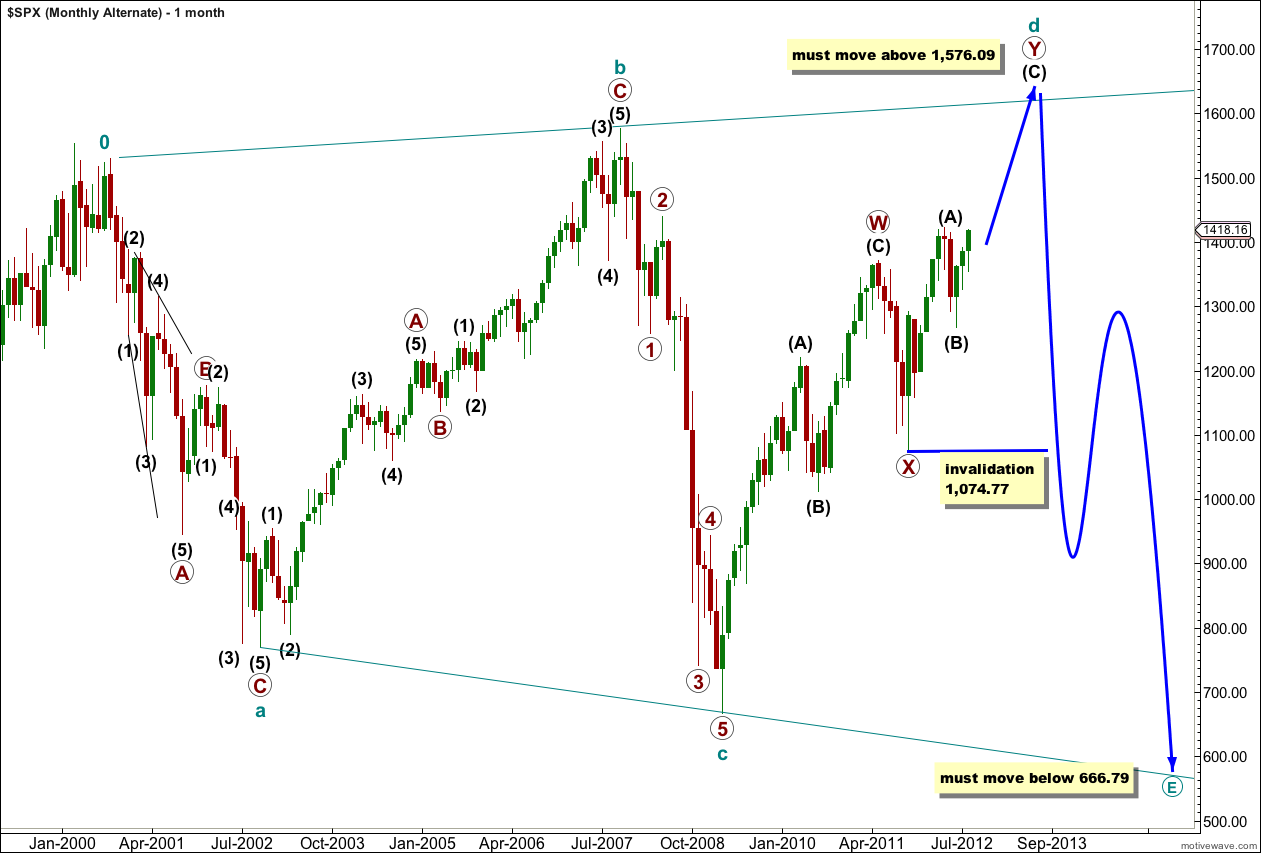
The other possibility which I would more seriously consider if price moves above 1,463 is that at super cycle degree the S&P is within a very rare expanding triangle.
This wave count has a very low probability for 2 reasons:
1. Expanding triangles are exceedingly rare. In my years of daily Elliott wave analysis (since mid 2008) I have only seen two of which I can be certain in hindsight.
2. The structure of cycle waves a – b – c fit absolutely perfectly as a flat correction. To see this as the first three waves in a triangle would be in my experience a mistake. A double combination would be much more likely here (which is what the main wave count looks at).
Within a triangle one of the subwaves should be longer lasting and more complicated. This is usually either the C or D wave. In this instance cycle wave d may be subdividing as a double zigzag structure.
Within an expanding triangle wave d must move beyond the end of wave b. This wave count requires movement to a new all time high above 1,576.09.
Thereafter, the market would make a new low. Wave e must move below the end of wave c at 666.79.