
The SPX500 has again moved sideways within a narrow range. Market behaviour over the last 4 sessions fits nicely into the main hourly wave count and this wave count has a higher probability.
With more structure complete I can now calculate a target for the main wave count.
The alternate remains valid and will serve as the most likely scenario if the main wave count is invalidated tomorrow.
Click on the charts below to enlarge.
Main Wave Count.
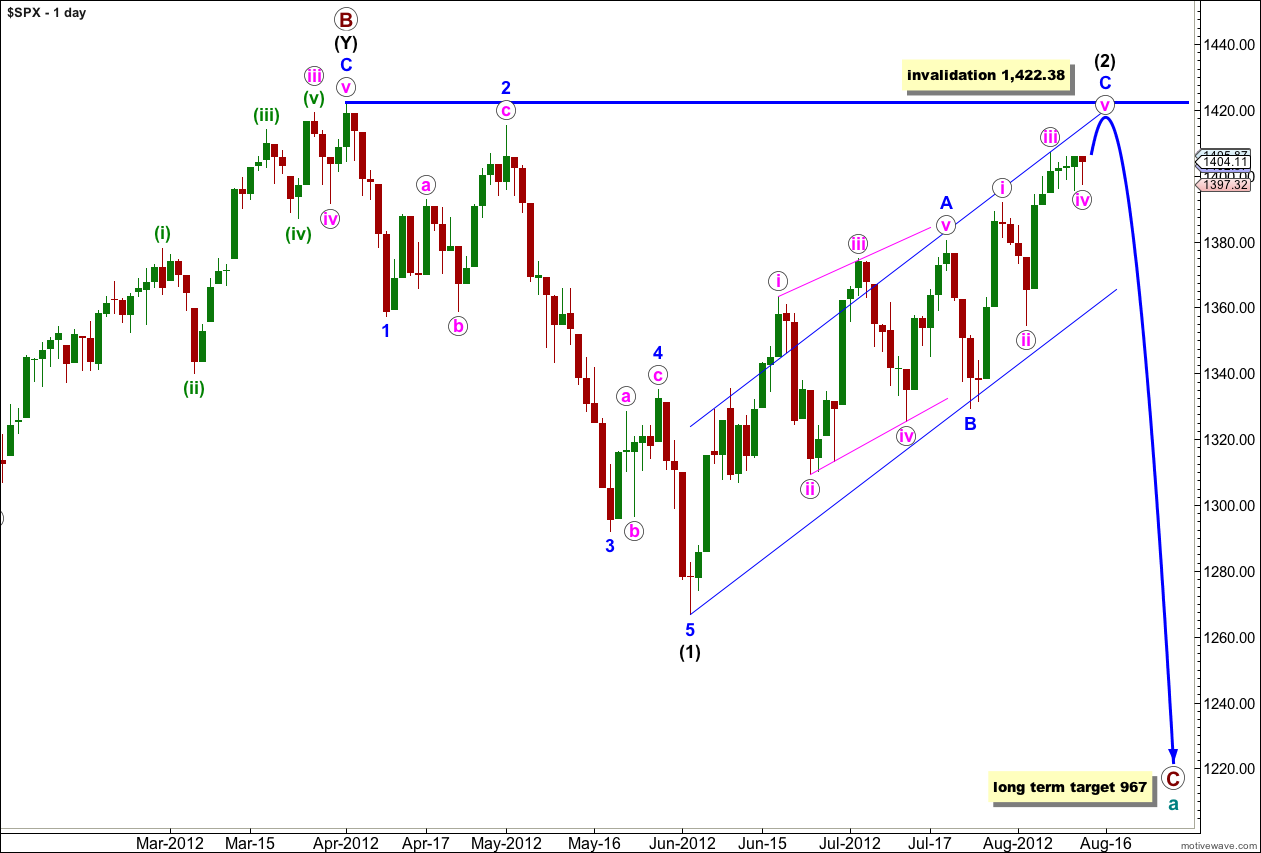
If wave (2) black is a single zigzag then wave A blue was a leading diagonal and it would be likely that wave C blue would be an impulse to see alternation between the two.
We may use Elliott’s channeling technique to draw a parallel channel about wave (2) black. When this channel is breached by downwards movement we should have confirmation of a trend change. Prior to confirmation of a trend change we must accept the possibility of new highs.
When wave C blue is confirmed as complete then the only way that wave (2) black could continue further would be as a very rare triple zigzag. The rarity of triples means the probability of wave (2) black continuing further is extremely low. Also, for the S&P 500 to continue further within this correction it would diverge significantly with the Dow. For the Dow the only corrective structure which fits the upwards movement and meets all rules is a triple zigzag, so when this last movement is over the correction cannot continue further.
Wave (2) black may not move beyond the start of wave (1) black. This wave count is invalidated with movement above 1,422.38.
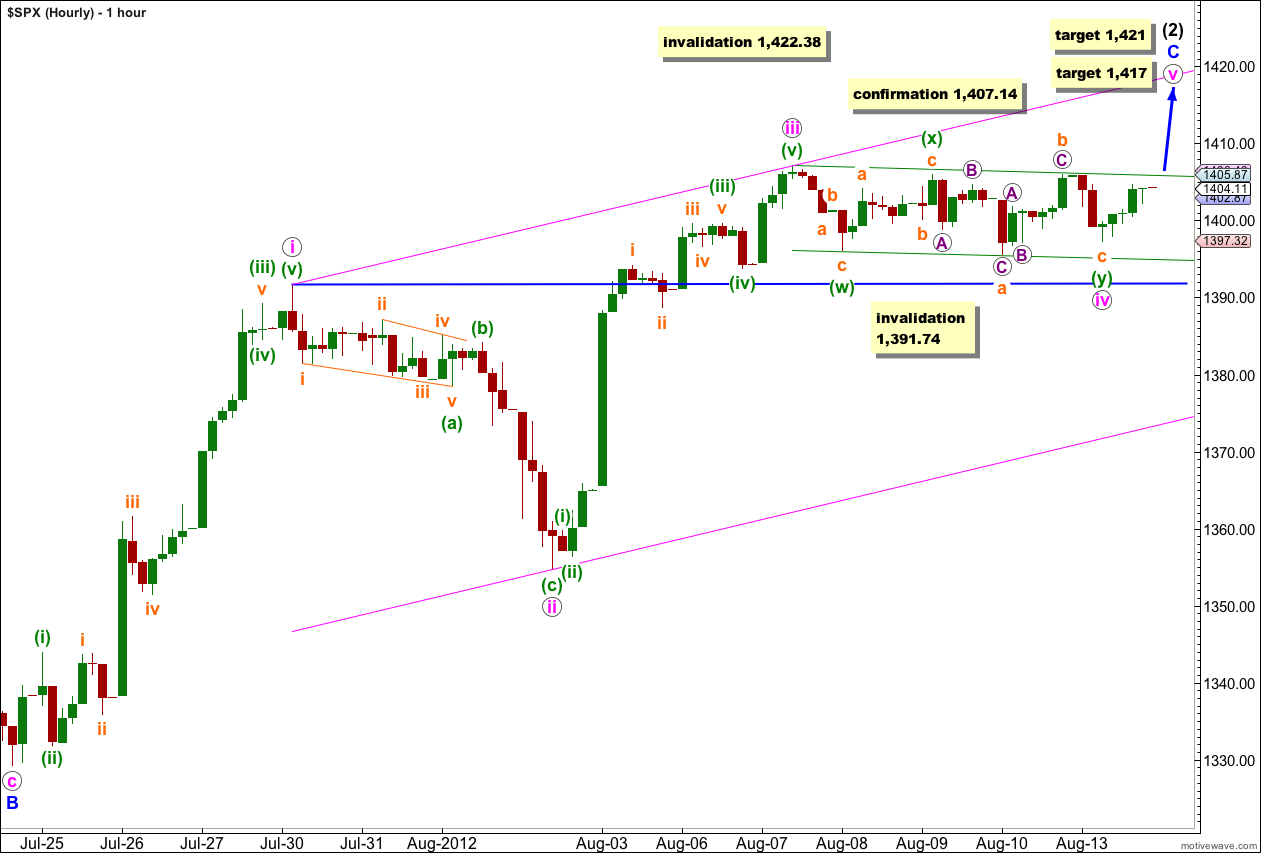
Because Monday’s session did not begin with the little upwards movement that I had expected the previous labeling of this sideways movement is invalid. Wave iv pink cannot be a single flat correction because wave (b) green within it did not reach 90% the length of wave (a) green.
Wave iv pink can be labeled as a double combination correction. Wave (w) green was a short zigzag, wave (x) green may be seen as a zigzag, and wave (y) green may now be a complete running flat correction.
The downwards movement during Monday’s session subdivides perfectly into a five wave impulse on the 5 minute chart, indicating that it is now very likely that wave iv pink is finally over.
There is perfect alternation between wave ii pink as a relatively deep (59%) zigzag correction and wave iv pink a very shallow (19%) combination correction.
At this stage this main hourly wave count looks very typical.
There is no Fibonacci ratio between waves iii and i pink. That means it is more than likely we shall see a Fibonacci ratio between wave v pink and either of i or iii pink.
At 1,417 wave v pink would reach 0.382 the length of wave iii pink. If price continues to rise through this first target then the next likely target is at 1,421 where wave v pink would reach 0.382 the length of wave i pink.
In the short term if wave iv pink continues further sideways and / or a little lower it may not move into wave i pink price territory. This wave count is invalidated with movement below 1,391.74.
When we have a new high above 1,407.14 this main wave count would be confirmed as the alternate would be invalidated. At that stage also the short term invalidation point would probably no longer apply.
The wider pink parallel channel is drawn about wave C blue using Elliott’s first channeling technique. Draw the first trend line from the highs of waves i to iii pink, then place a parallel copy upon the low labeled ii pink. The upper edge of this channel may be where wave v pink ends. When this channel is breached by subsequent downwards movement then we shall have some confirmation of a trend change.
I have drawn a best fit channel about wave iv pink. Wave v pink upwards should clearly breach this small green channel.
This main wave count expects one final thrust upwards probably to a new high. This final wave may take one to three sessions to complete.
Alternate Wave Count.
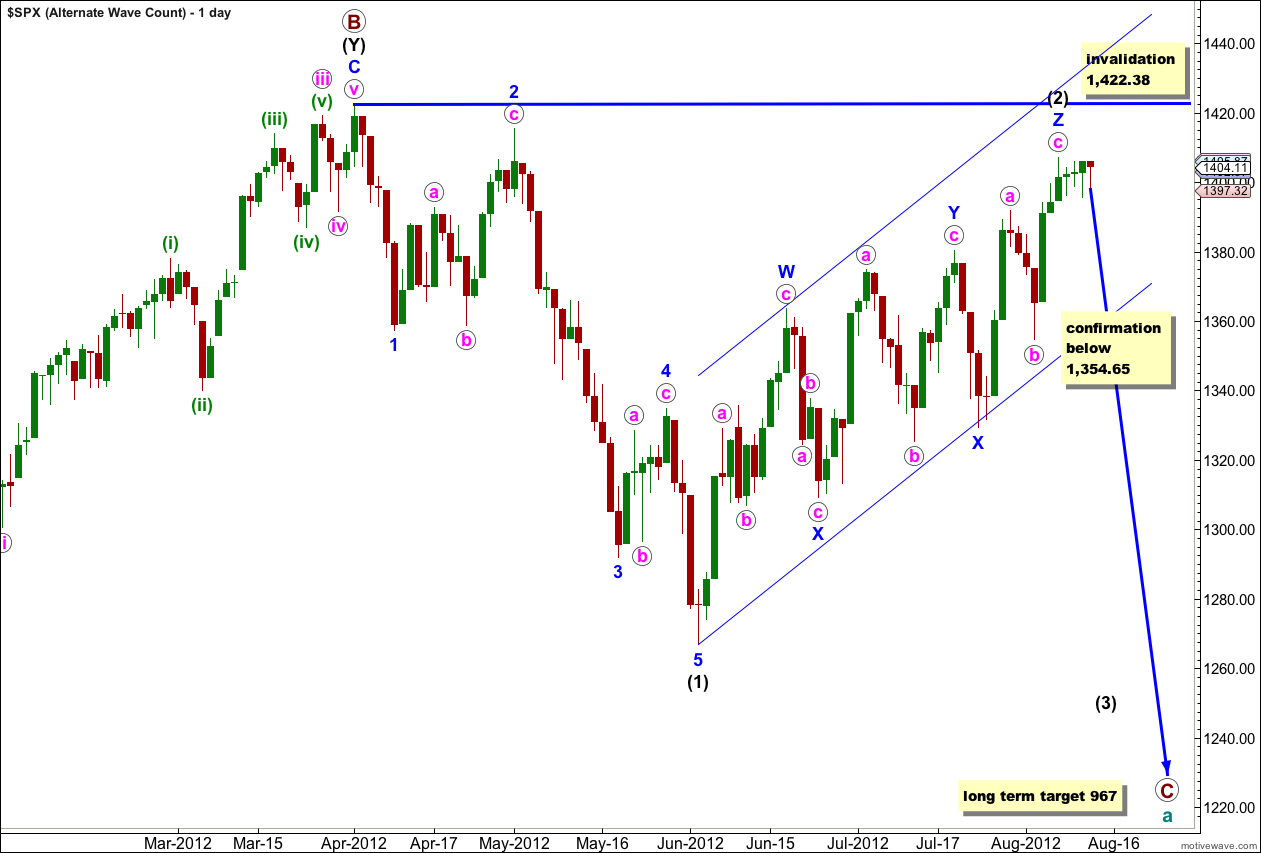
It is also possible that wave (2) black is a very rare triple zigzag. Although the rarity of this structure reduces the probability of this wave count, it is valid and all subdivisions mostly fit.
If this is correct then the final wave c pink of wave Z blue may be complete. Downwards movement below the start of wave c pink at 1,354.65 would confirm a trend change.
Wave (2) black may not move beyond the start of wave (1) black. This wave count is invalidated with movement above 1,422.38.
Further sideways movement during Monday’s session reduces the probability of this wave count.
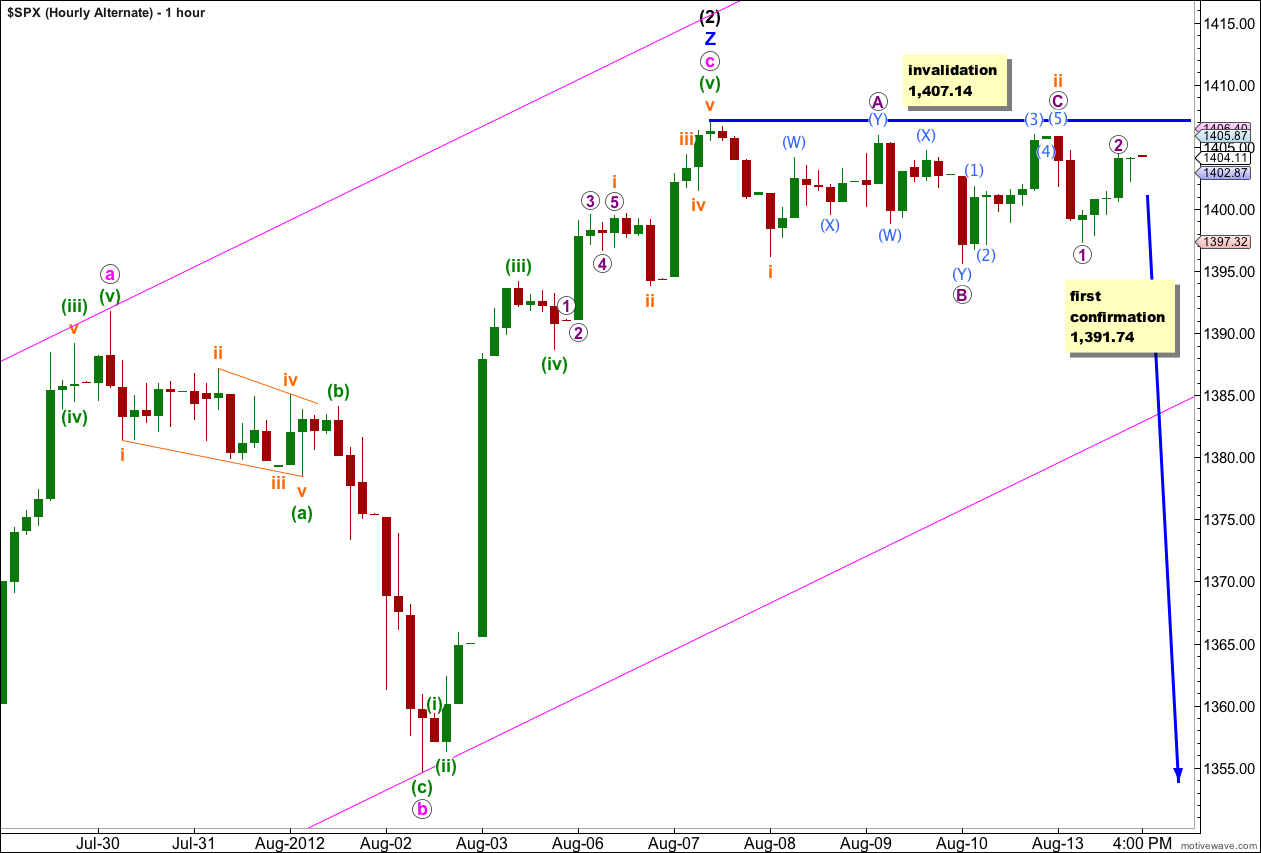
The upwards wave labeled C purple of ii orange does not subdivide very well as a five wave structure on the 5 minute chart. This also reduces the probability of this wave count slightly.
If price moves below 1,391.74 then this wave count would be confirmed and the main wave count invalidated. At that stage we should expect and increase in downwards momentum as a third wave unfolds.
Also, at that stage I would want to see the parallel channel on this hourly chart breached by clear downwards movement to have confidence in this wave count.
Any further upwards movement and continuation of wave ii orange may not move beyond the start of wave i orange. This wave count is invalidated with movement above 1,407.14.