
Last week’s analysis of the Dow expected more upwards movement towards a target at 13,155 to 13,160. Price has risen to reach 55.9 points above the upper end of the target zone.
Sideways movement of the last three days can be interpreted differently. I have two wave counts at the hourly chart level and the confirmation / invalidation point is very close by.
I still have just one daily wave count.
Click on the charts below to enlarge.
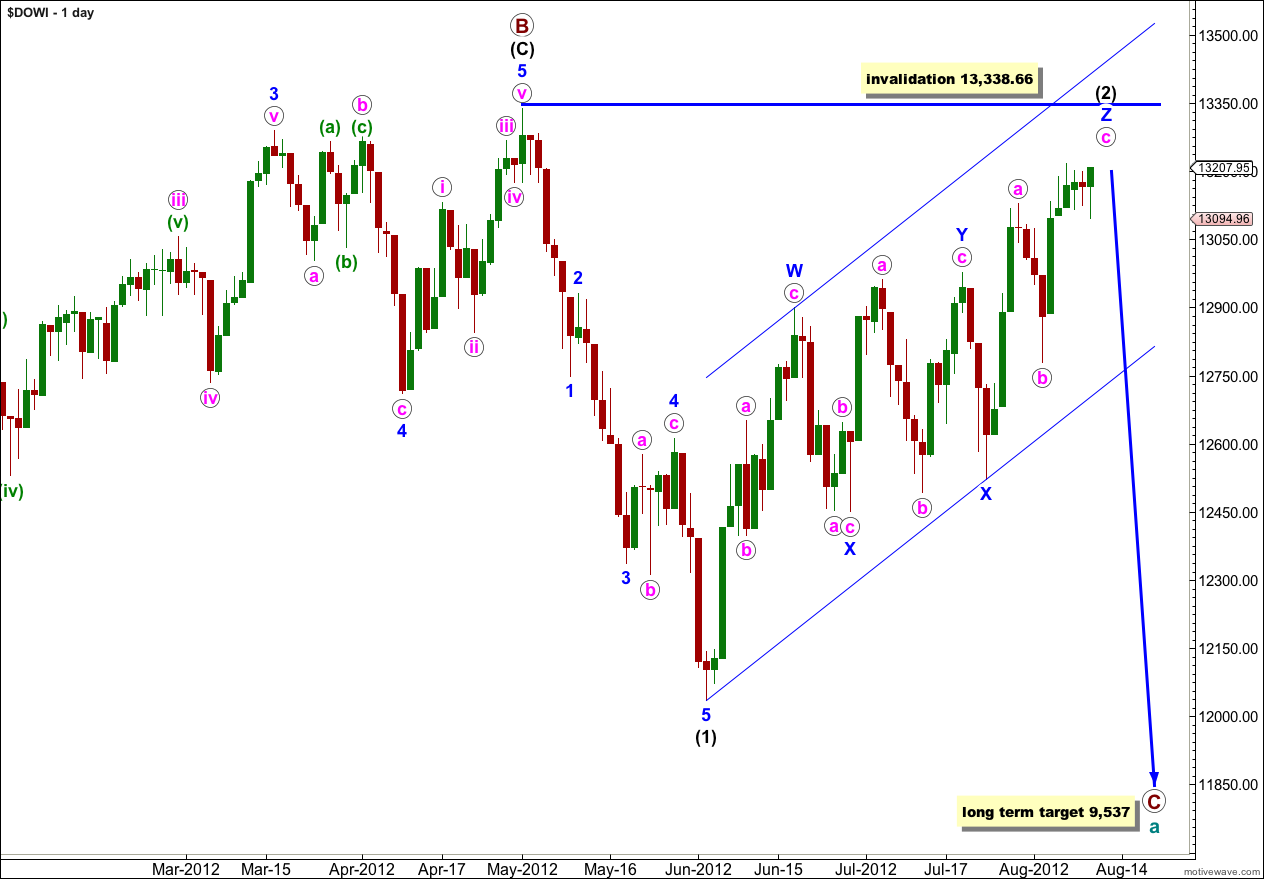
Wave (2) black may be unfolding as a very rare triple zigzag. The subdivisions all fit and the purpose of a triple zigzag to deepen a correction is being achieved; movement is clearly upwards and not sideways.
Within the third zigzag of wave Z blue the structure is either incomplete requiring several more sessions (main hourly wave count) or was complete three days ago (alternate hourly wave count).
Cycle wave a is an expanded flat because primary wave B within it is over 105% the length of primary wave A. An expanded flat expects a C wave to move substantially beyond the end of the A wave. At 9,537 primary wave C would achieve this and would be a typical 1.618 the length of primary wave A.
Wave (2) black may not move beyond the start of wave (1) black. This wave count is invalidated with movement above 13,338.66.
Main Hourly Wave Count.
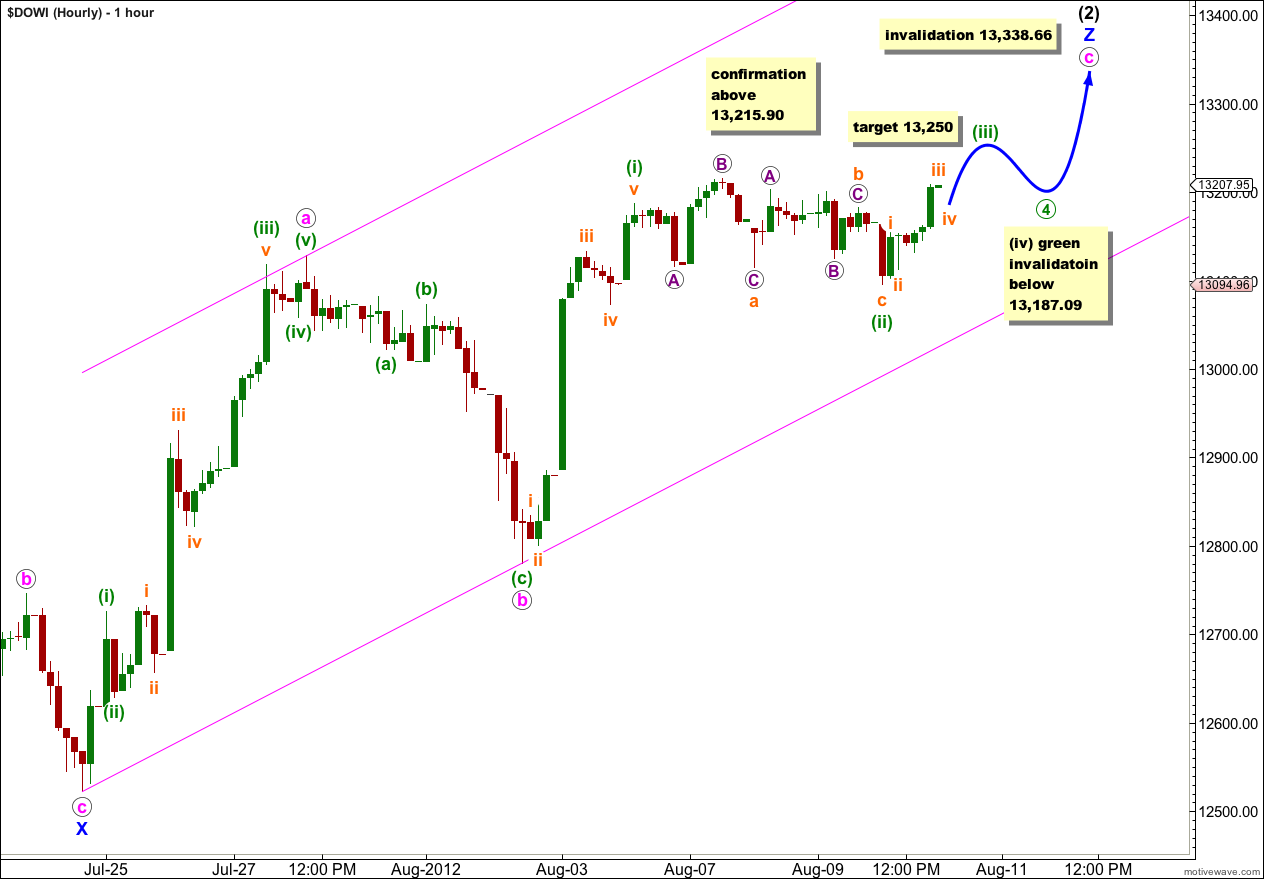
Within wave c pink only waves (i) and (ii) green may be complete. This wave count expects further upwards movement lasting several sessions. However, there is very little room to move as the invalidation point is very close by at 13,338.66.
Wave (iii) green would reach 0.618 the length of wave (i) green at 13,250.
Thereafter, wave (iv) green may not move into wave (i) green price territory. Movement below 13,187.09 at that stage would invalidate this wave count.
Thereafter, wave (v) green upwards would end the structure at all wave degrees. Wave (v) green would probably be brief and short if this wave count is correct.
We may use Elliott’s channeling technique to draw a parallel channel about the zigzag of wave Z blue. When this channel is clearly breached by downwards movement then we shall have a strong indication that we have had a trend change.
Movement above 13,215.9 would confirm this wave count.
Alternate Hourly Wave Count.
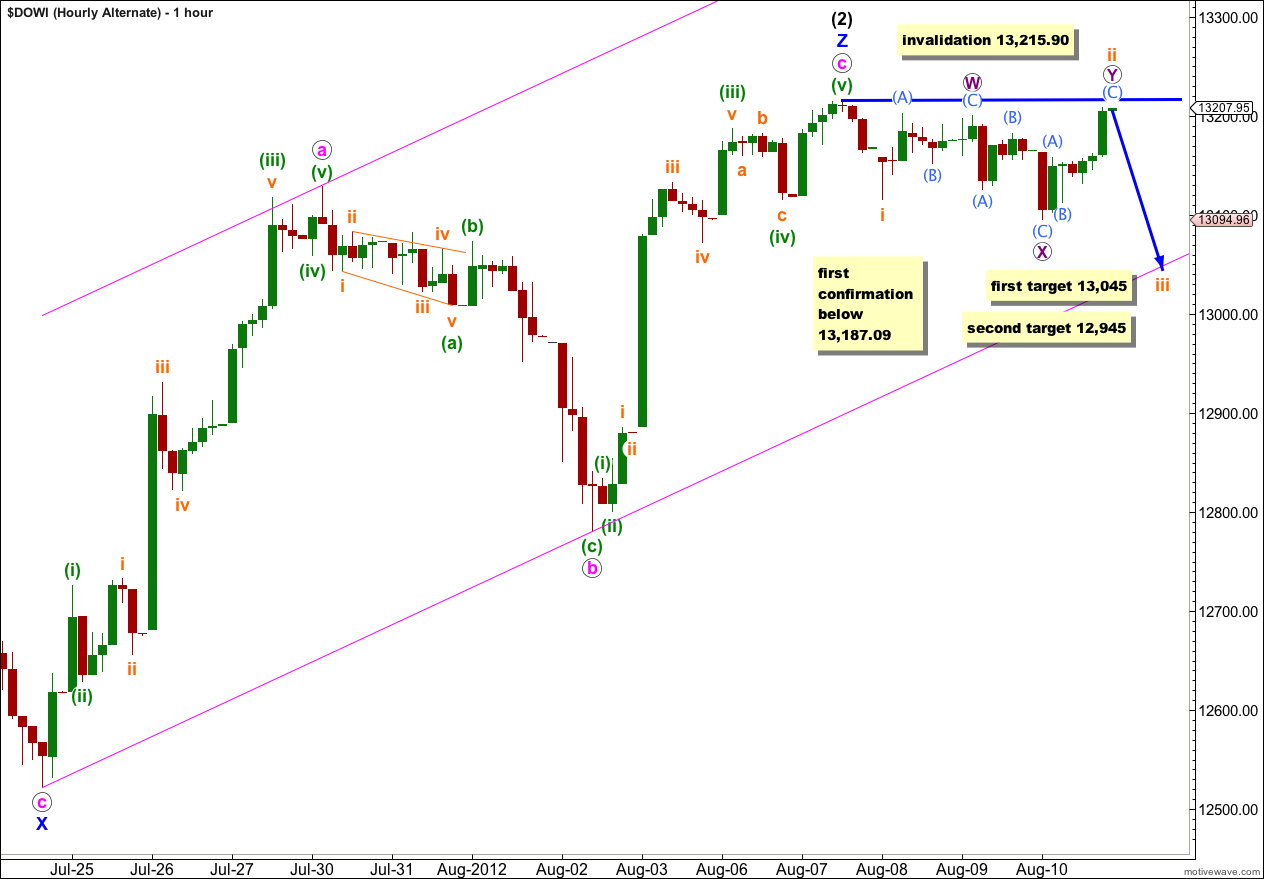
Alternatively, it is possible that wave (2) black is complete. Recent movement over the last three days may have been a deep second wave correction.
At 13,045 wave iii orange would reach 1.618 the length of wave i orange. If price falls through this first target then the next target is at 12,945 where wave iii orange would reach 2.618 the length of wave i orange.
Movement below 13,187.09 would provide some confidence in this wave count as at that stage the main wave count would be invalidated.
Movement below the parallel channel on this hourly chart would provide further confidence in this wave count. Movement below the parallel channel on the daily chart would provide full confidence that we have seen a major trend change.
Any further upwards movement of wave ii orange may not move beyond the start of wave i orange. This wave count is invalidated with movement above 13,215.90.