
Last analysis expected upwards movement for both the main and alternate wave counts. The short term target was at 1,412 – 1,417 and price has fallen well short of this.
At this point the main wave count and alternate wave counts diverge. I will use confirmation / invalidation points to determine which wave count is correct over the next one or two sessions. The price point which differentiates the two wave counts is very close, and we may have clarification early during tomorrow’s session.
Click on the charts below to enlarge.
Main Wave Count.
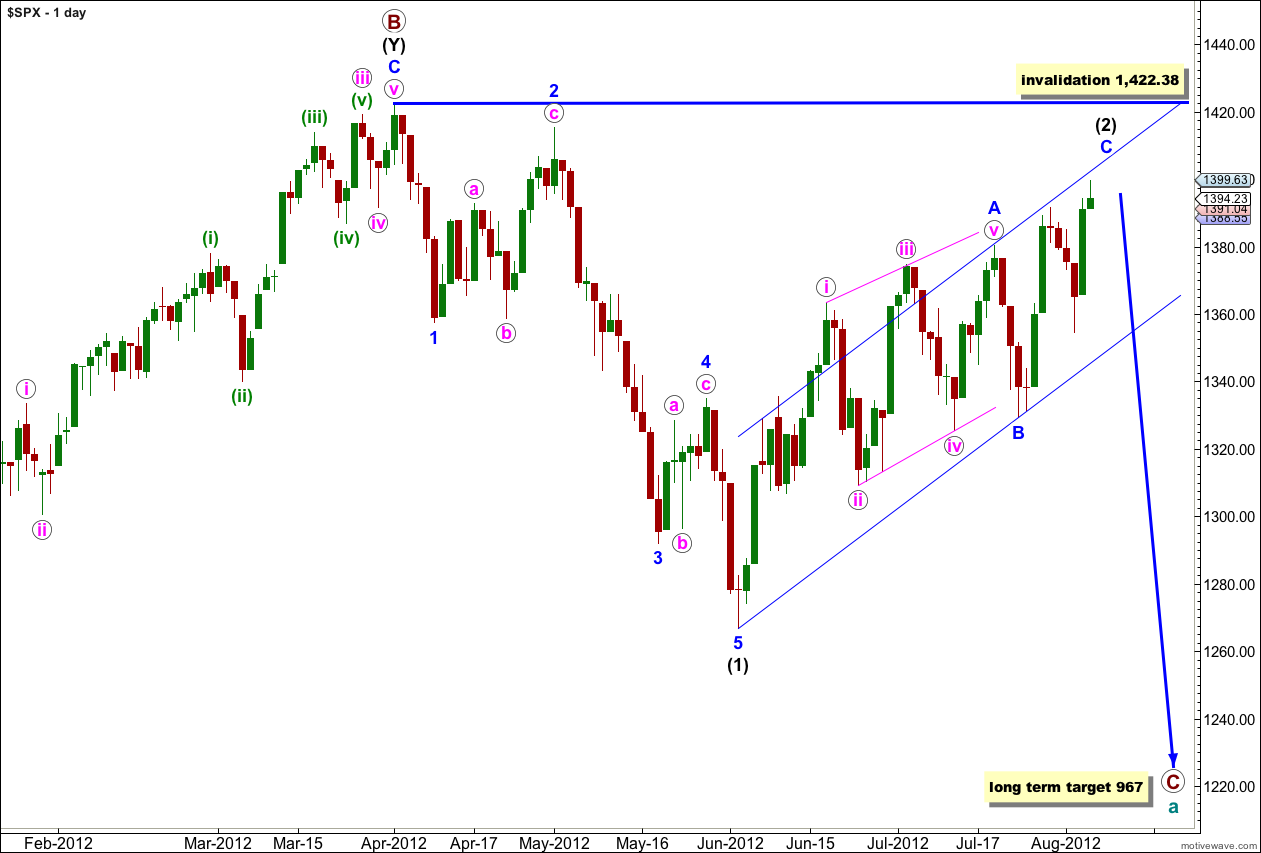
Within wave (2) black wave A blue was a leading diagonal and it would be likely that wave C blue would be an impulse to see alternation between the two. With price movement above 1,391.74 wave C blue cannot be over.
We may use Elliott’s channeling technique to draw a parallel channel about wave (2) black. When this channel is breached by downwards movement we should have confirmation of a trend change. Until we have some confirmation of a trend change we must accept the possibility of new upwards movement.
When wave C blue is confirmed as complete then the only way that wave (2) black could continue further would be as a very rare triple zigzag. The rarity of triples means the probability of wave (2) black continuing further is extremely low. Also, for the S&P 500 to continue further within this correction it would diverge significantly with the Dow. For the Dow the only corrective structure which fits the upwards movement and meets all rules is a triple zigzag, so when this last movement is over the correction cannot continue further.
Wave (2) black may not move beyond the start of wave (1) black. This wave count is invalidated with movement above 1,422.38.
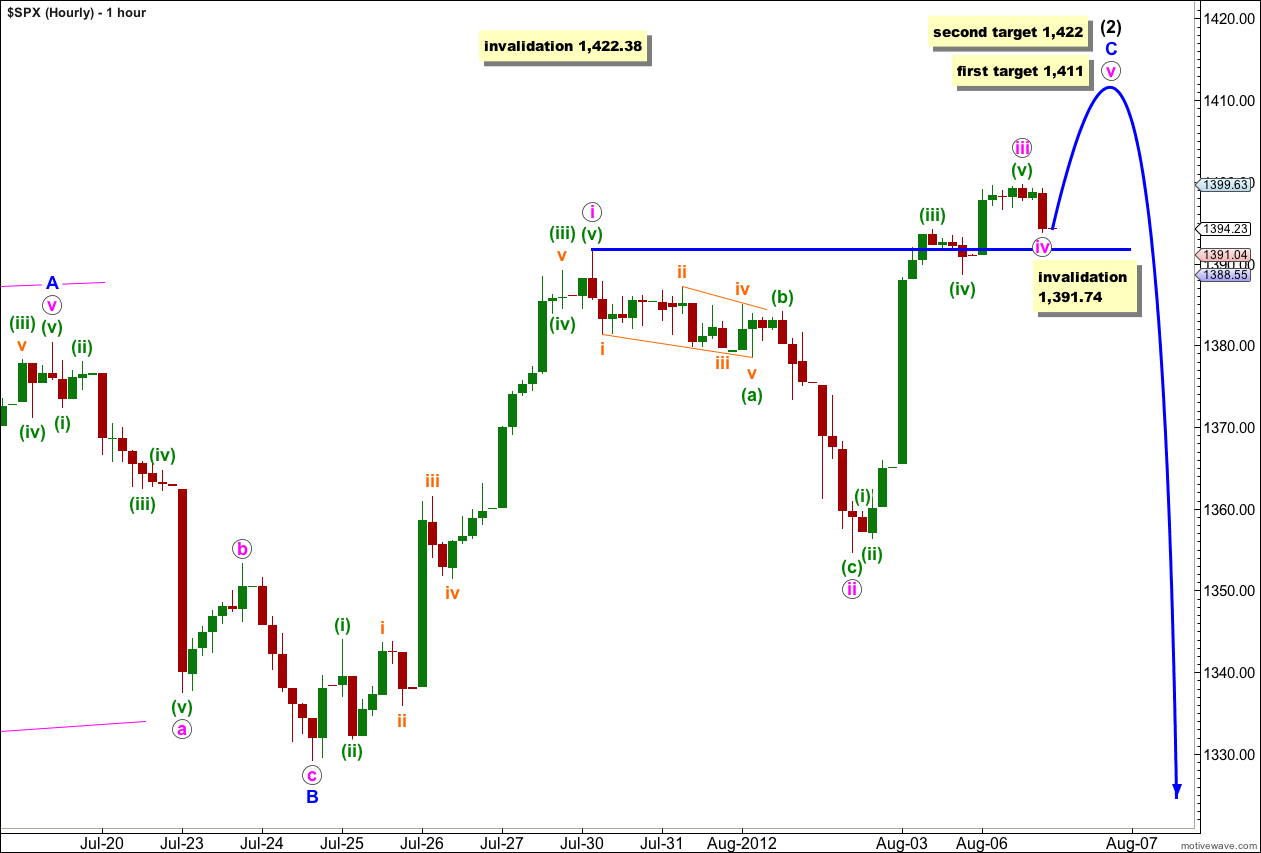
With wave iii pink ending only a little above the end of wave i pink so far there is very little room for wave iv pink to move in.
Ratios within wave iii pink are: wave (iii) green is 3.14 points longer than 6.854 the length of wave (i) green, and there is no Fibonacci ratio between wave (v) green and either of (i) or (iii) green.
At this stage it would be reasonably likely that wave iv pink continues further sideways as a double combination to be more in proportion to wave ii pink. On the 5 minute chart wave iv pink may be a zigzag structure but the final wave c downwards within it is incomplete.
If this wave count remains valid then wave iv pink is likely to end close to where price is now. If this is the case then at 1,411 wave v pink would reach 0.382 the length of wave iii pink, and at 1,422 wave v pink would reach 0.618 the length of wave iii pink.
Wave iv pink may not move into wave i pink price territory. This wave count is invalidated with movement below 1,391.74. If this wave count is invalidated then we shall use the alternate below .
Alternate Wave Count.
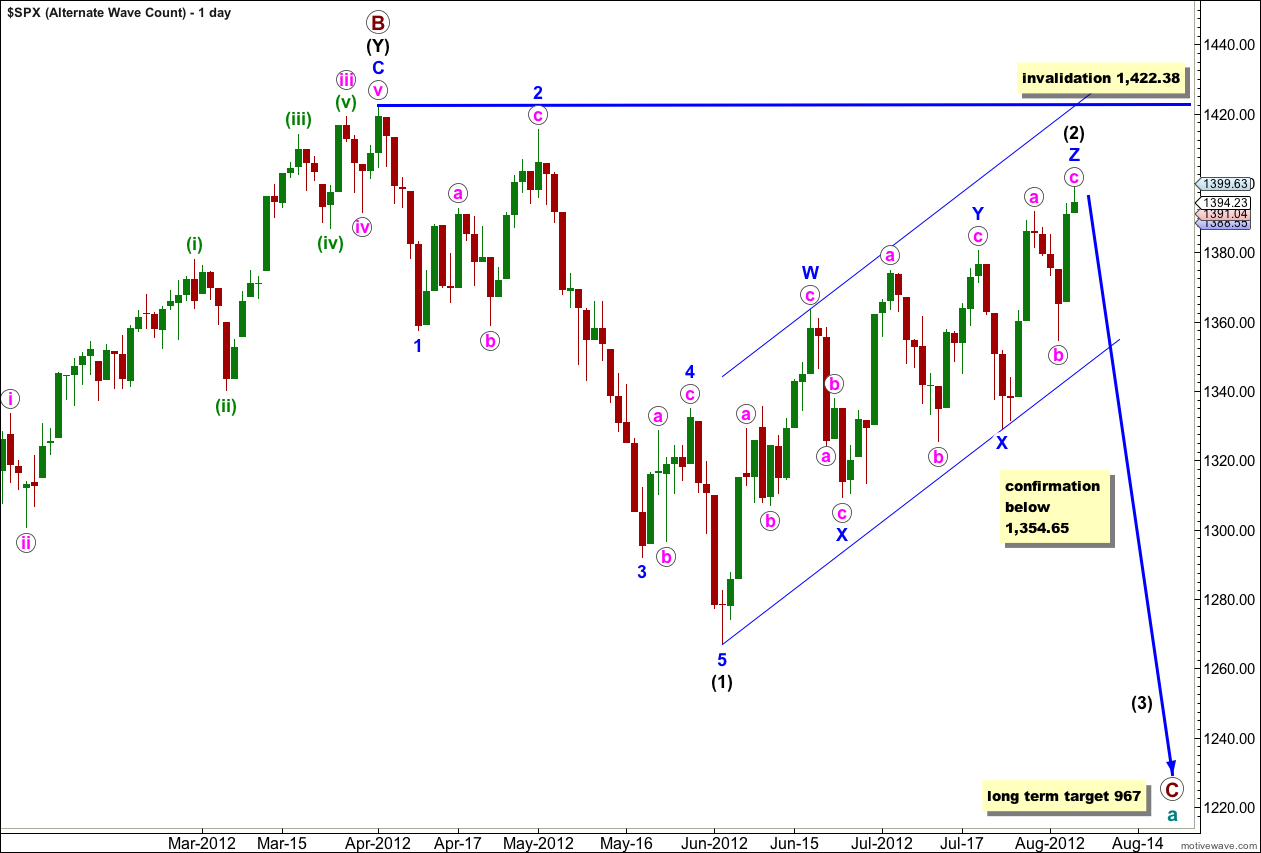
It is also possible that wave (2) black is a very rare triple zigzag. The rarity of this structure reduces the probability of this wave count, but it is valid and all subdivisions do fit.
If this is correct then the final wave c pink of wave Z blue may be complete. Downwards movement below the start of wave c pink at 1,354.65 would confirm a trend change.
This alternate wave count expects there may have been a trend change during Monday’s session. However, prior to any confirmation of a trend change I will leave the invalidation point on the daily chart at the start of wave (1) black and allow for further upwards movement within wave c pink.
Wave (2) black may not move beyond the start of wave (1) black. This wave count is invalidated with movement above 1,422.38.

At this stage the final wave c pink within wave Z blue may now be seen as a complete impulsive structure. However, while price remains above 1,388.69 it is possible that wave c pink may extend higher. Movement below the start of wave (v) green within wave c pink at 1,388.69 would confirm the final upwards impulsive wave as over and would give strong indication of a trend change.
A channel drawn about wave c pink using either of Elliott’s techniques does not contain the fifth wave of this movement; the channel is breached also by downwards movement.
There is divergence with price trending higher and MACD trending lower on time frames at 6 hourly and less.
This wave count looks very good despite the low probability of a triple zigzag. I would want to see the parallel channel on the daily chart clearly breached to have confidence in a trend change though. In the first instance a channel breach on the hourly chart here would provide some confidence.