
Last week’s analysis expected Monday to begin with upwards movement. Price did make a new high during Monday’s session but fell well short of the target at 13,193. Thereafter, the main wave count expected downwards movement to unfold as a clear three wave structure and to be more long lasting. This is exactly what happened and price remained well above the invalidation point at 12,521.88.
Thereafter, the main wave count expected more upwards movement to new highs which is again exactly what happened to end the trading week.
The main wave count is unfolding nicely and the structure looks typical. With more structure complete I can calculate a target for it to end.
Click on the charts below to enlarge.
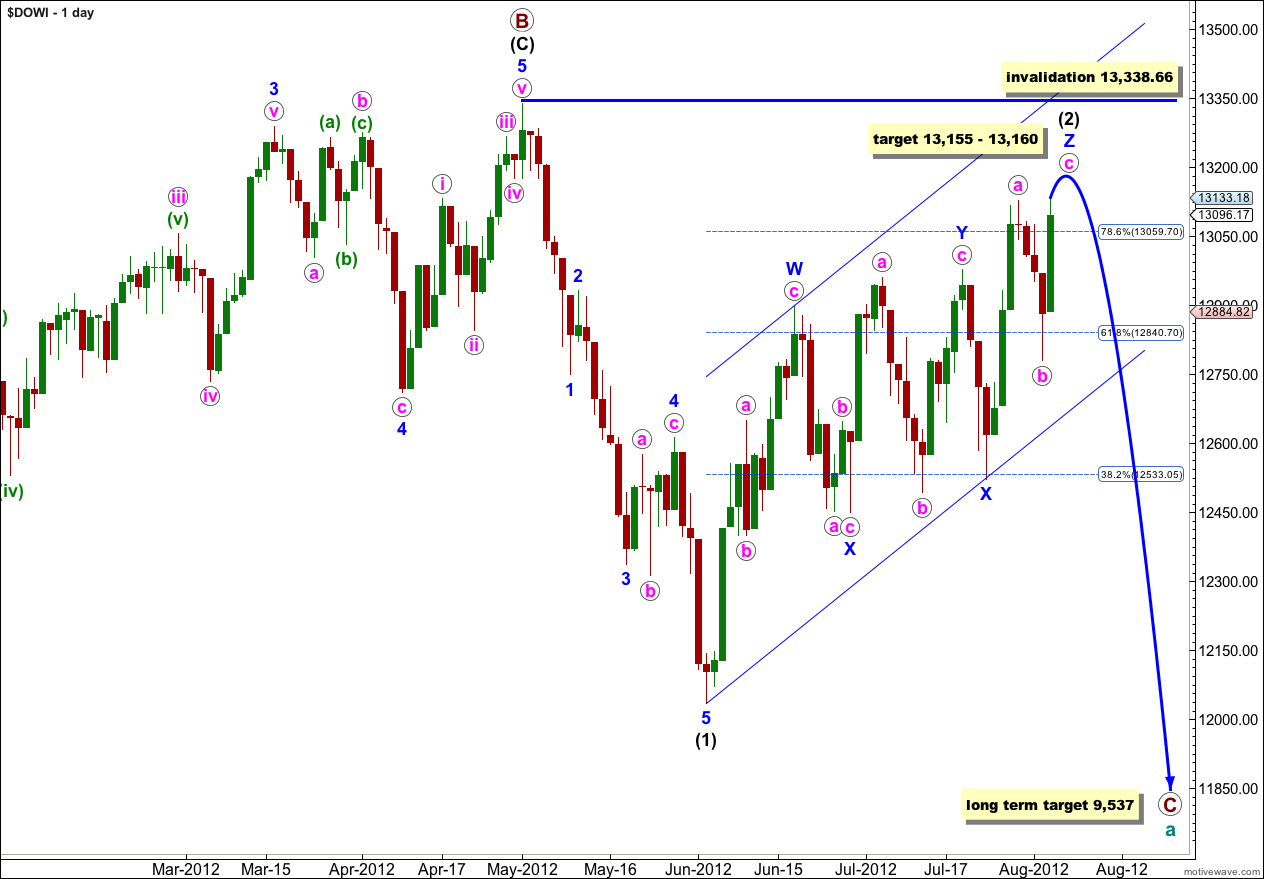
Wave (2) black may be unfolding as a very rare triple zigzag. The subdivisions all fit and the purpose of a triple zigzag to deepen a correction is being achieved, the movement is clearly upwards and not sideways.
Within the third zigzag of wave Z blue the structure is most likely incomplete. It requires one final upwards wave which could be over in another one or two sessions.
Cycle wave a is an expanded flat because primary wave B within it is over 105% the length of primary wave A. An expanded flat expects a C wave to move substantially beyond the end of the A wave. At 9,537 primary wave C would achieve this and would be a typical 1.618 the length of primary wave A.
Wave (2) black may not move beyond the start of wave (1) black. This wave count is invalidated with movement above 13,338.66.
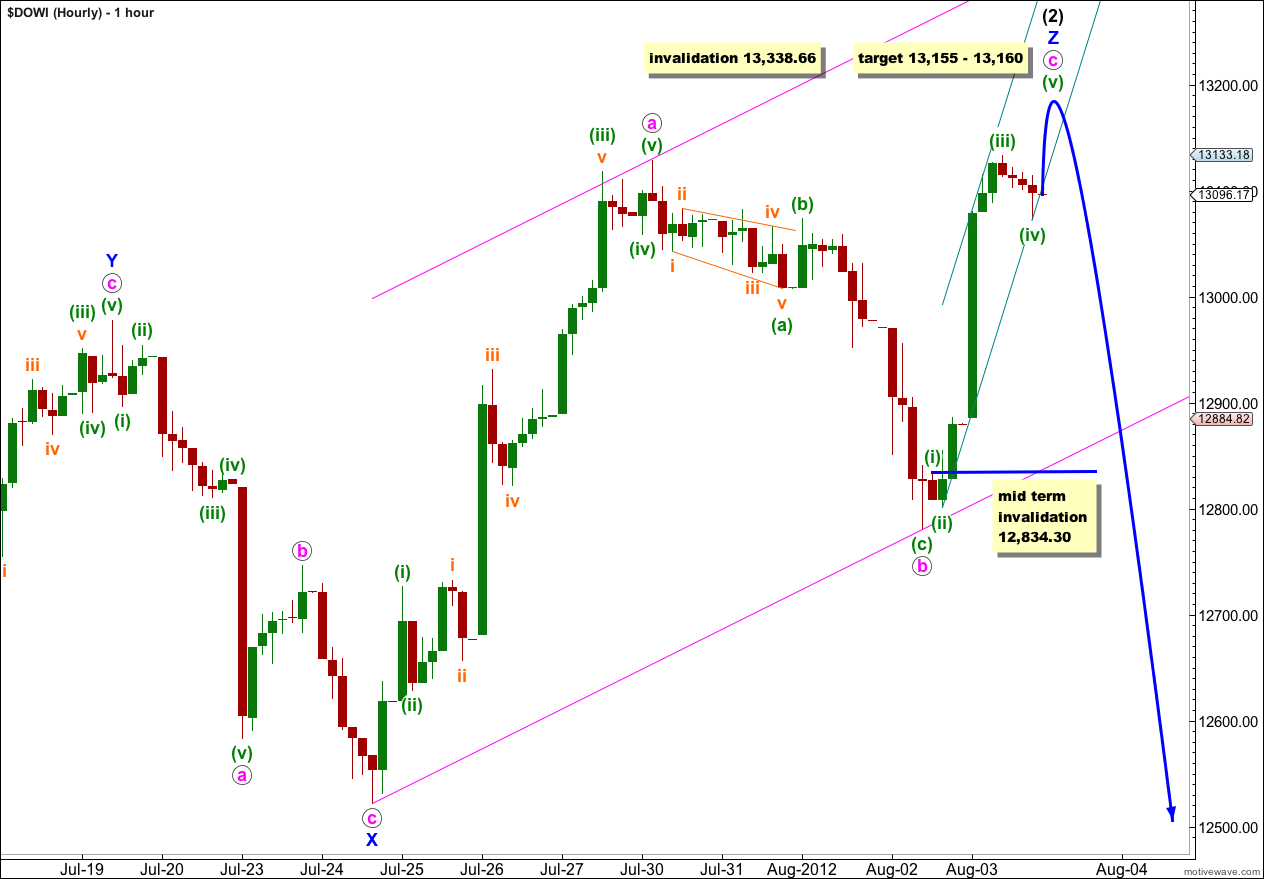
Within wave Z blue waves a and b pink are now complete.
Ratios within wave a pink are: wave (iii) green is 45.8 points short of 2.618 the length of wave (i) green (a 9.3% variation, less than 10% is acceptable), and wave (v) green has no Fibonacci ratio to either of (i) or (iii) green.
Ratios within wave (iii) green are: wave iii orange is 2.9 points short of 2.618 the length of wave i orange, and wave v orange is 21.31 points longer than equality with wave iii orange.
Within wave b pink wave (c) green is 22 points longer than 2.618 the length of wave (a) green.
At 13,155 wave c pink would reach 0.618 the length of wave a pink. At 13,160 wave (v) green would reach 1.618 the length of wave (i) green. This gives us a 5 point target zone for one final upwards fifth wave.
When markets open on Monday morning any further downwards movement for wave (iv) green may not move into wave (i) green price territory. In the short term this wave count is invalidated with movement below 12,834.30.
When we have a final fifth wave upwards complete then this wave count expects a trend change. This trend change is likely to happen next week.
At that stage downwards movement below this parallel channel, and below 12,780.42 would confirm a trend change.