Last week’s analysis was invalidated with movement below 12,784.43. Movement above 12,977.57 during Friday’s session indicates that this correction is obviously not over.
I have the one daily wave count with two hourly wave counts this week.
Click on the charts below to enlarge.
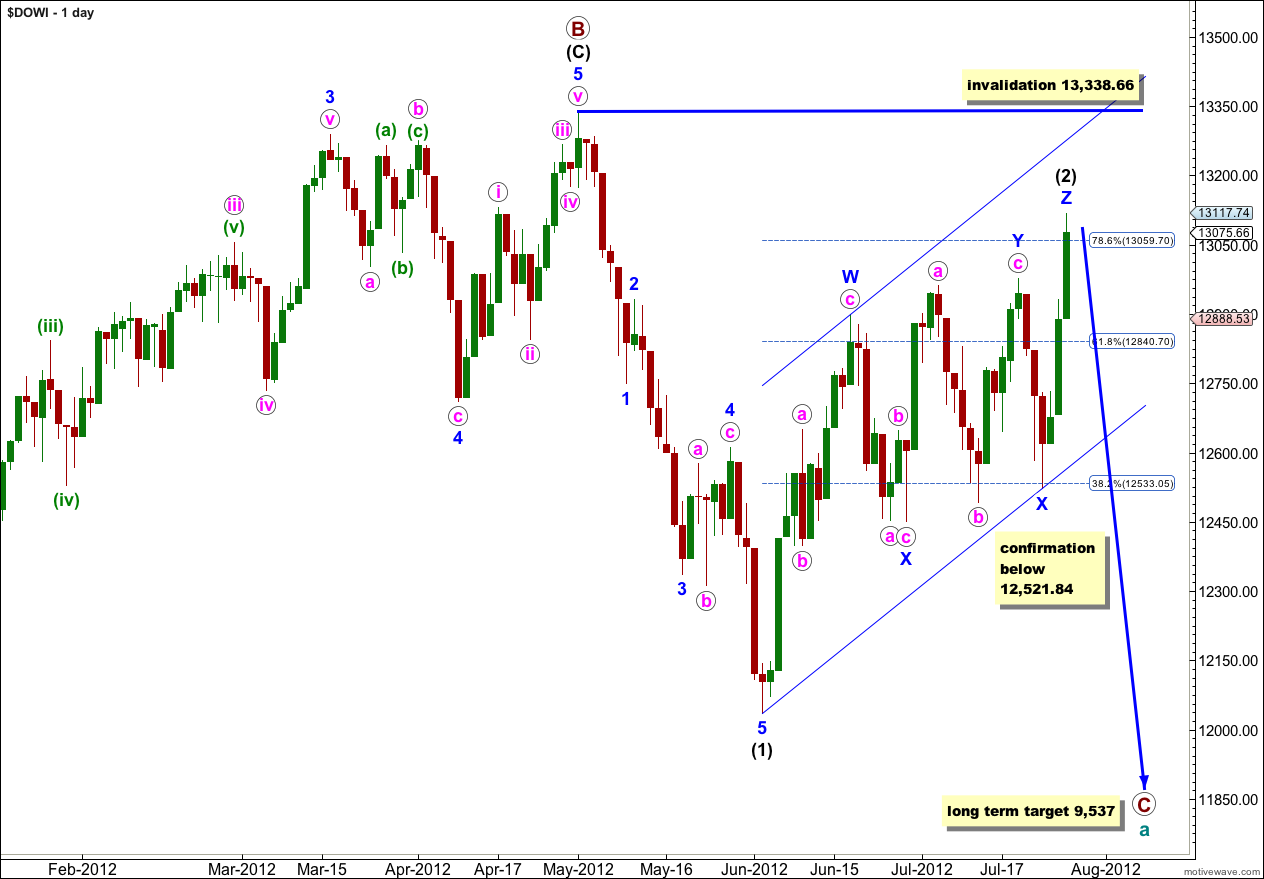
Wave (2) black may be unfolding as a very rare triple zigzag. The subdivisions all fit and the purpose of a triple zigzag to deepen a correction is being achieved, the movement is clearly upwards and not sideways.
Within the third zigzag of wave Z blue the structure is most likely incomplete.
I had expected that when the second zigzag in this correction for wave (2) black was complete that the probability the entire correction was complete would be very high. At that stage the only way that wave (2) black could continue further would be as a very rare triple and the rarity of triples meant that probability was very low. However, the problem with low probability structures is that when they do occur they almost always take us by surprise.
I have considered another possibility for wave (2) black: that it may be a single zigzag with a leading diagonal for wave A blue, ending at the high labeled wave Y blue on the chart above. However, the wave lengths of a leading diagonal in that position are imperfect which reduces the probability significantly. The only structure which is corrective here where the subdivisions fit is a triple zigzag.
Cycle wave a is an expanded flat because primary wave B within it is over 105% the length of primary wave A. An expanded flat expects a C wave to move substantially beyond the end of the A wave. At 9,537 primary wave C would achieve this and would be a typical 1.618 the length of primary wave A.
Wave (2) black may not move beyond the start of wave (1) black. This wave count is invalidated with movement above 13,338.66.
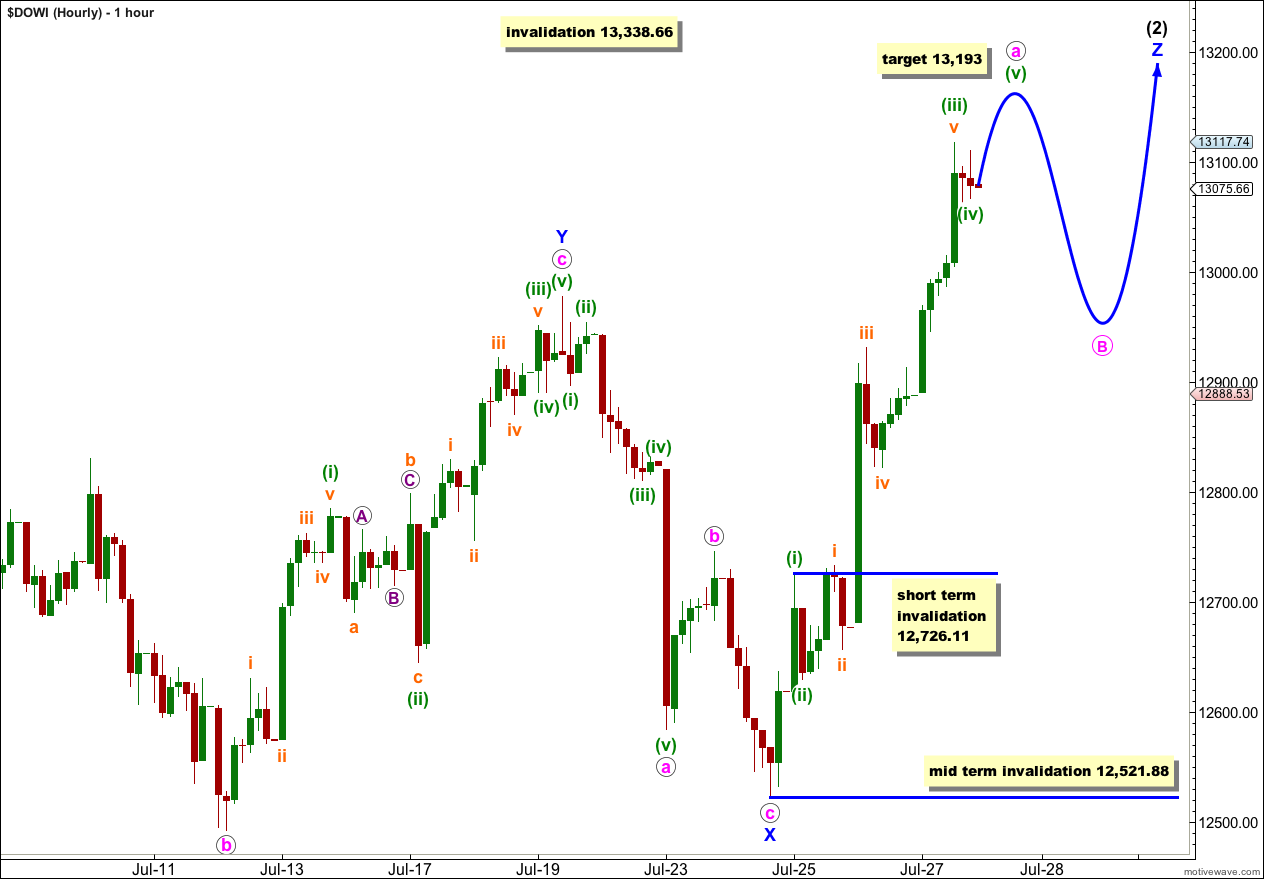
Main Hourly Wave Count.
Within the third zigzag labeled wave Z blue the structure is most likely incomplete. It should have a three wave look on the daily chart and at this stage it looks most like an impulse.
Within wave Z blue wave a pink is most likely incomplete. At 13,193 wave (v) green would reach 0.618 the length of wave (i) green.
When markets open on Monday any further downwards movement of wave (iv) green may not move into wave (i) green price territory. This wave count is invalidated in the short term with movement below 12,726.11.
Thereafter, wave b pink downwards should unfold and may not move beyond the start of wave a pink. This wave count is invalidated with movement below 12,521.88.
When we know where wave b pink has ended then a target for wave c pink upwards to end this whole correction may be calculated. I cannot do this today.
Overall I am expecting choppy overlapping generally trending upwards movement next week.
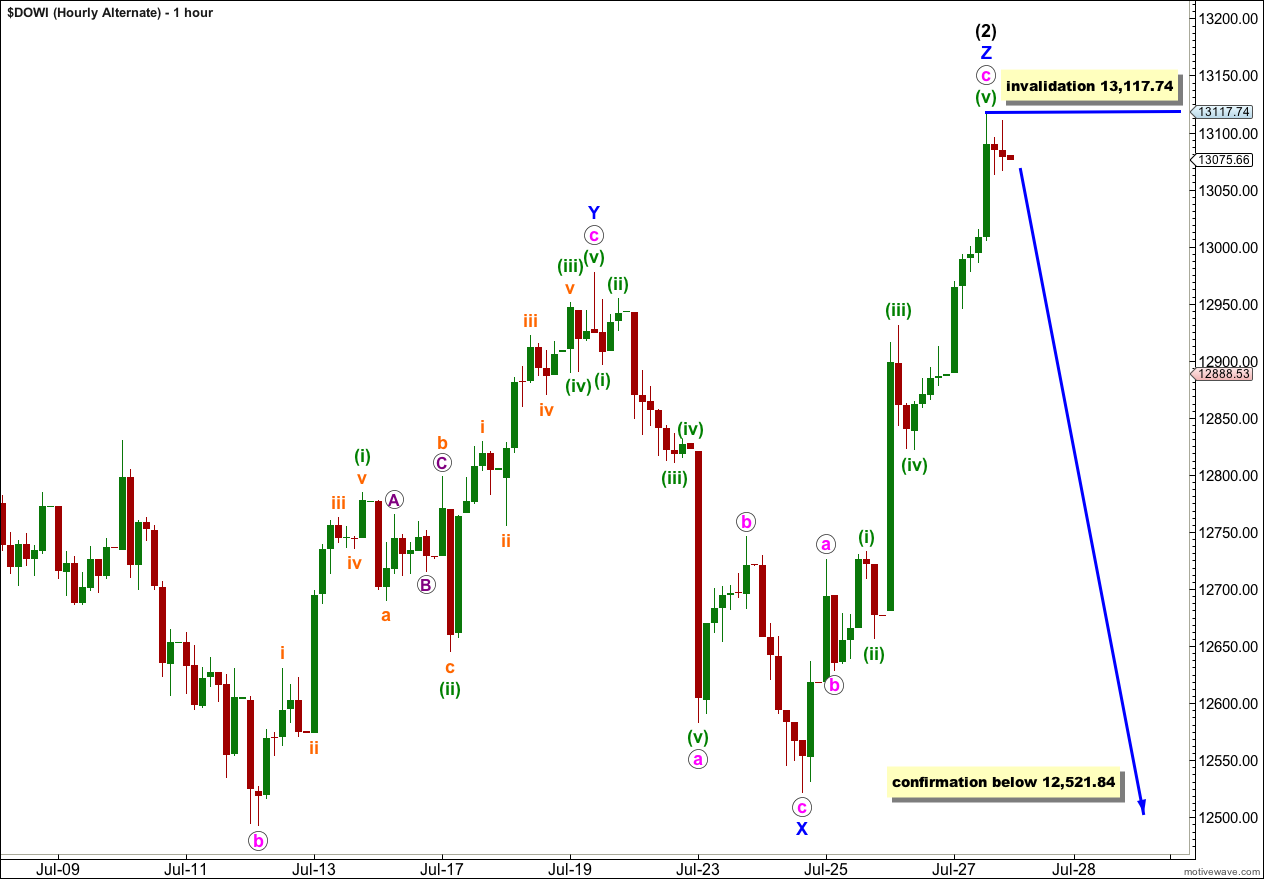
Alternate Hourly Wave Count.
It is possible that wave (2) black is over at the end of the week. This wave count has a low probability and should only be used if it is confirmed with movement below 12,521.84.
This wave count has a low probability because wave Z blue does not have a three wave look to it on the daily chart, and it is very brief in comparison to waves W and Y blue.
Wave Z blue has a count of 7 at this stage which is corrective. There is no Fibonacci ratio between waves a and c pink.
Ratios within wave c pink are: wave (iii) green is just 2.9 points longer than 2.618 the length of wave (i) green, and wave (v) green is 21.31 points longer than equality with wave (iii) green.
Any movement above 13,117.74 would invalidate this wave count as within wave (3) black no second wave correction may move beyond the start of the first wave.


