
There was no confirmation of a trend change last week and we had to allow for the possibility of new highs as per the alternate wave count for the Dow.
Movement above 12,961.3 invalidated the main hourly wave count and confirmed the alternate.
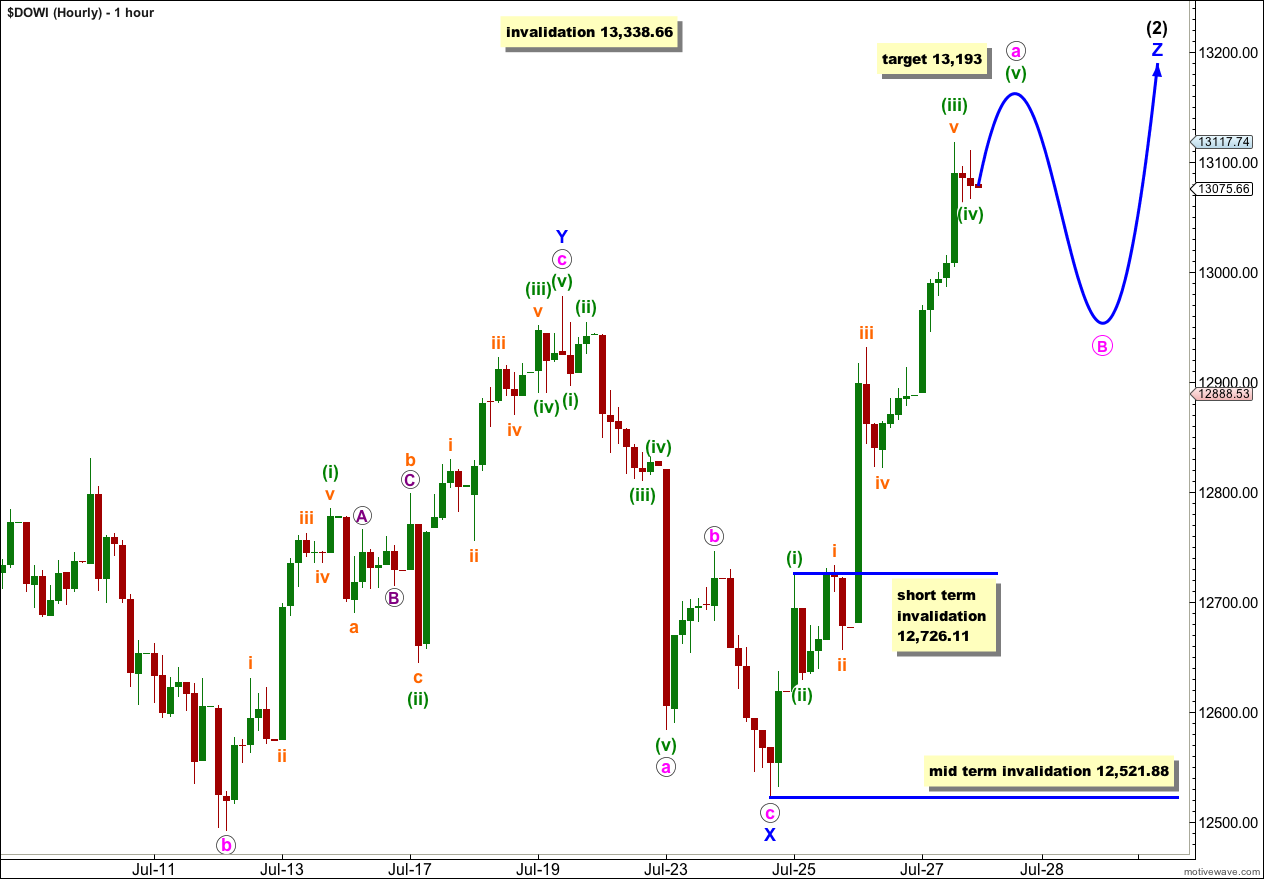
I have adjusted the hourly wave count to one which has a much better look and fit. The target for this movement to end has a very good probability.
Click on the charts below to enlarge.
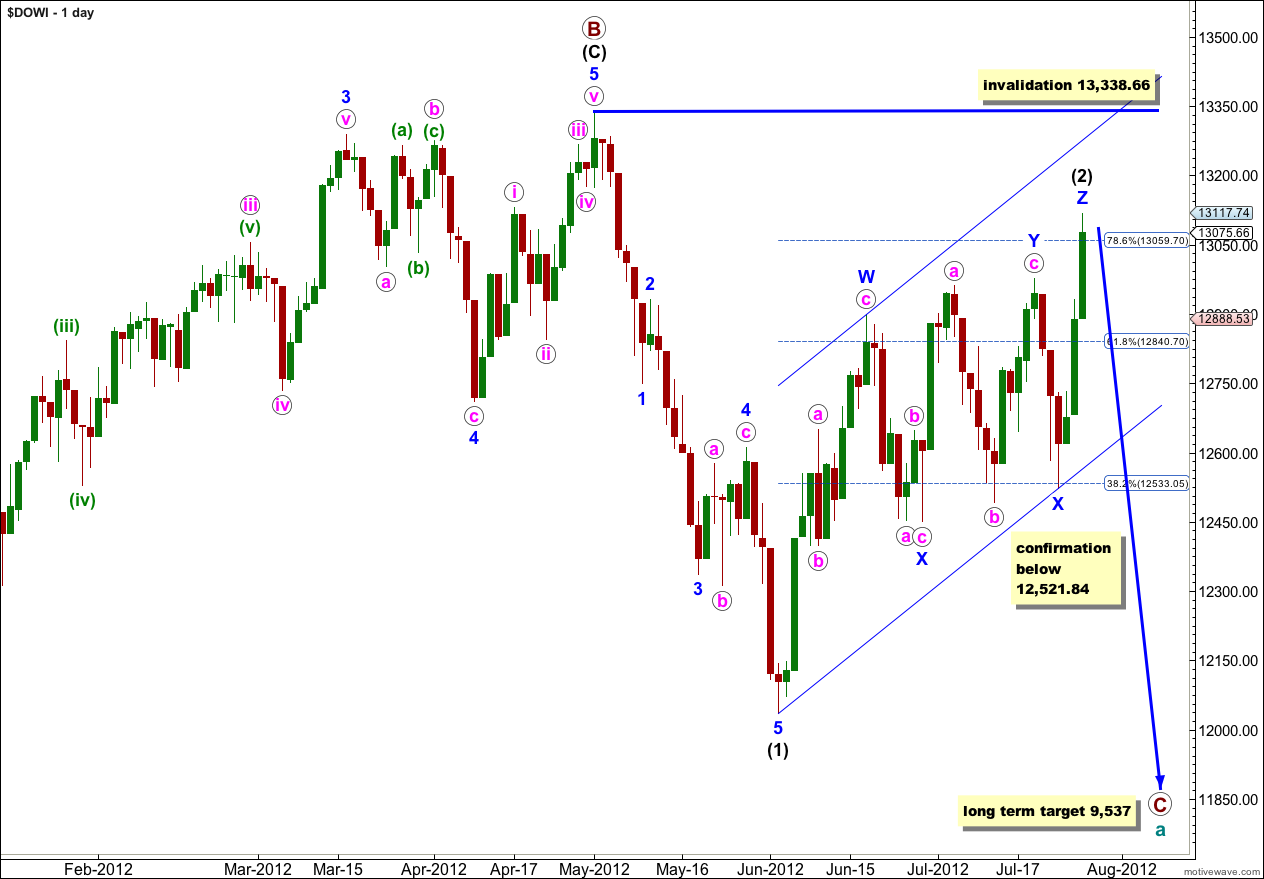
Cycle wave a is an expanded flat because primary wave B within it is over 105% the length of primary wave A. An expanded flat expects a C wave to move substantially beyond the end of the A wave. At 9,537 primary wave C would achieve this and would be a typical 1.618 the length of primary wave A.
Wave (2) black is an incomplete double combination correction, with a zigzag labeled wave W blue followed by a flat for wave Y blue. Within wave Y blue the final wave c pink is incomplete.
I have redrawn the parallel channel about wave (2) black to contain all this movement and so be more conservative. When this channel is breached by downwards movement we shall have confirmation of a trend change.
Doubles are fairly common. For wave (2) black to continue further once the second structure of wave Y blue is complete would be as a very rare triple. The rarity of triples means that when the second structure is finished the probability that the whole correction is over and the next movement would be a third wave down is very high indeed.
Wave (2) black may not move beyond the start of wave (1) black. This wave count is invalidated with movement above 13,338.66.
I have adjusted this wave count to see wave Y blue as a flat correction. Wave b pink is a 93% correction of wave a pink so the minimum requirement of 90% for a flat is met, and both waves a and b subdivide best as threes.
Within wave a pink flat wave (b) green is a 104% correction of wave (a) green. Wave (c) green is just 16.83 points longer than 2.618 the length of wave (c) green.
Within wave b pink zigzag there is no Fibonacci ratio between waves (a) and (c) green. Within wave (c) green there are no Fibonacci ratios between waves i, iii and v orange.
Within wave c pink wave (iii) green is 13.7 points longer than equality with wave (i) green (a variation of 4.4% and so acceptable).
Within wave (iii) green there are no Fibonacci ratios between waves i, iii and v orange.
Wave (ii) green was an expanded flat correction with wave b orange a 115% correction of wave a orange and wave c orange just 0.82 points longer than 1.618 the length of wave a orange.
So far wave (iv) green also looks like and expanded flat correction, with wave b orange a 151% correction of wave a orange, and no Fibonacci ratio between waves a and c orange.
Between these two flats there is variation in the depth of both the b and c waves.
I have drawn the parallel channel about this upwards movement using Elliott’s second channeling technique. Draw the first trend line from the lows of waves (ii) to (iv) green, then place a parallel copy upon the high of wave (ii) green. Wave (v) green may end either midway within the channel (more likely) or about the upper end of the channel (less likely). When the channel is breached by subsequent downwards movement then we shall have our first indication that wave (2) black may be over and wave (3) black may be underway.
If wave (iv) green moves lower the channel must be redrawn.
At this stage on the 5 and 1 minute charts all subdivisions within wave c orange of wave (iv) green are complete. It would be very likely that it was over at the end of Friday’s session.
At 12,999 wave (v) green would reach 0.618 the length of wave (iii) green.
At 12,996 wave c pink would reach equality in length with wave a pink.
This gives us a 3 point target zone for upwards movement to end.
When markets open on Monday any further downwards movement of wave (iv) green may not move into wave (i) green price territory. This wave count is invalidated with movement below 12,784.43.
If the wave count is invalidated with downwards movement before wave (v) green upwards has completed then it may be possible that wave (2) black is over and wave (3) black downwards could have begun. Trend channel confirmation on the daily chart would be required.