
Last week’s analysis expected the week to start with more downwards movement. The main hourly wave count had a target at 12,625 and the alternate at 12,366. Downwards movement ended at 12,492 before turning upwards.
I still have the one daily wave count with two hourly wave counts.
Click on the charts below to enlarge.
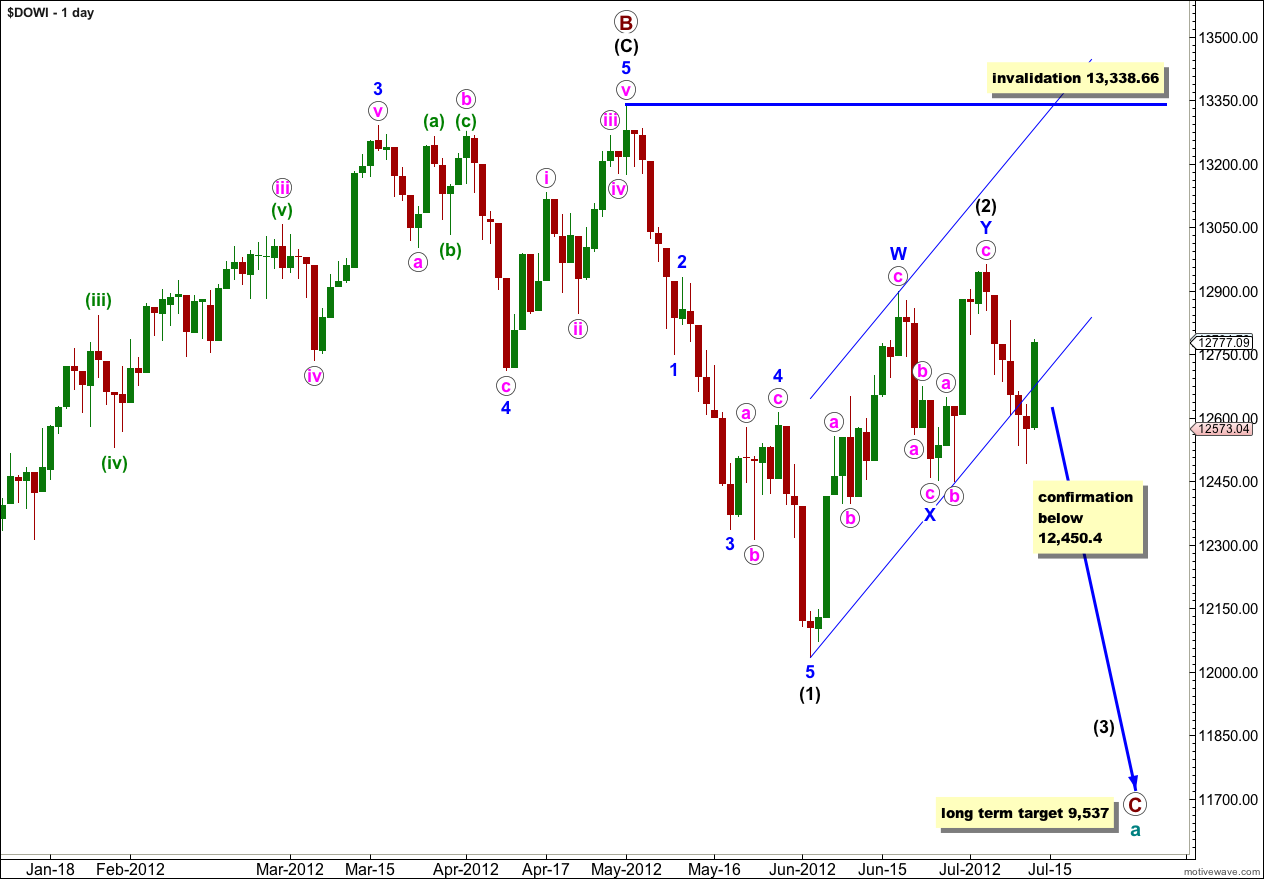
Wave (2) black may be complete again as a double combination correction, but it is important to wait for confirmation of this large trend change before we can have confidence that wave (3) black downwards has begun. When we have confirmation then I will calculate a target for wave (3) black. To do so prior to confirmation would be premature.
At this stage the price point of 12,450.4 is the only price point which would confirm a trend change, from the end of wave (2) black to the start of wave (3) black downwards. Although we have a trend channel breach with Thursday’s candlestick outside the channel, with Friday’s session taking price strongly back into the channel the breach is unconvincing. While price remains above 12,450.4 we must accept that it is possible that wave (2) black is not over and may move higher. Wave (2) black may not move beyond the start of wave (1) black. This wave count is invalidated with movement above 13,339.01.
Cycle wave a is an expanded flat because primary wave B within it is over 105% the length of primary wave A. An expanded flat expects a C wave to move substantially beyond the end of the A wave. At 9,537 primary wave C would achieve this and would be a typical 1.618 the length of primary wave A.
Main Hourly Wave Count.
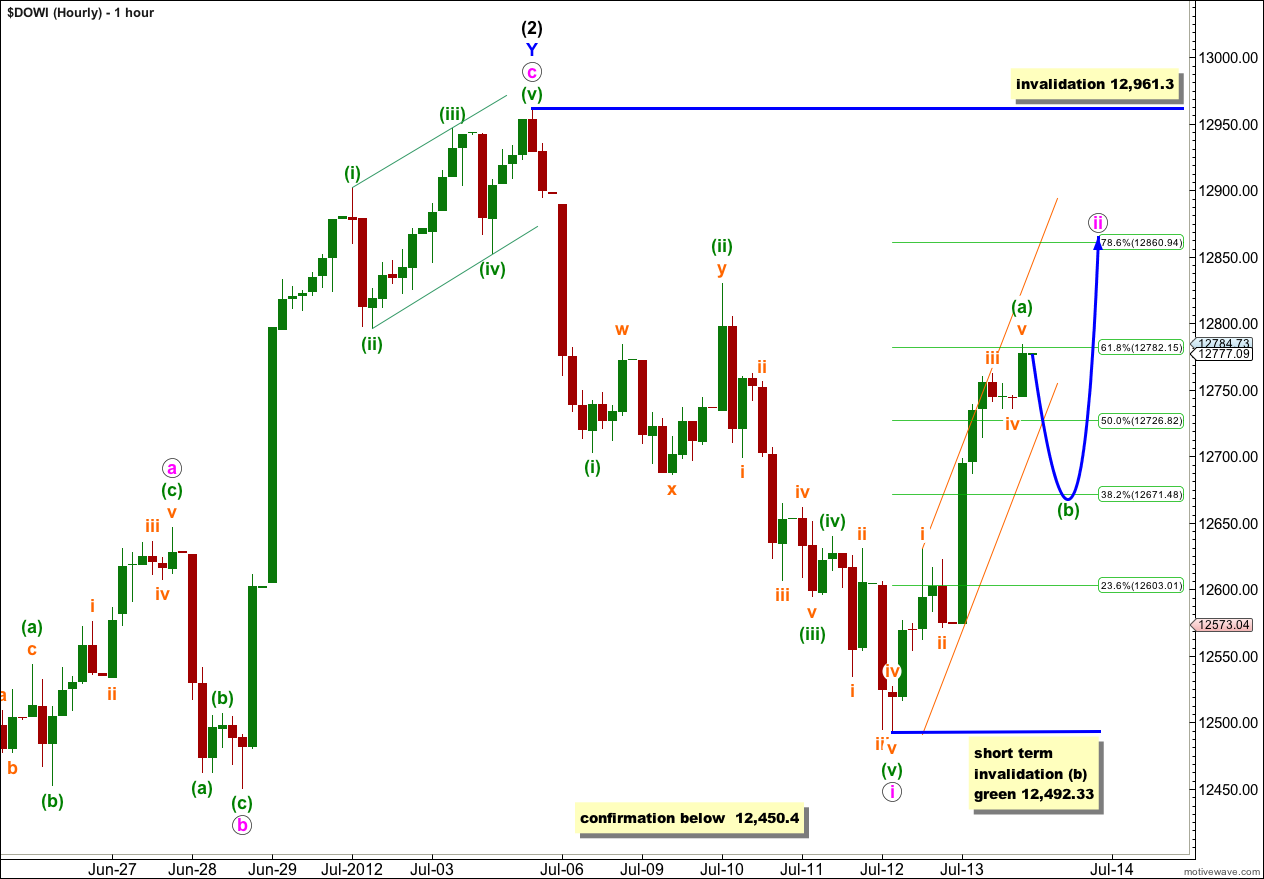
I am swapping over the main and alternate hourly wave counts from last week. With a channel breach (although unconvincing) on the daily chart, and more particularly the huge size of downwards movement labeled i pink, this wave count looks more likely.
Downwards movement labeled wave i pink is ambiguous on the 5 minute chart. It looks best as a five wave impulse with wave iv orange a perfect contracting triangle visible on the 5 minute chart.
Ratios within wave i pink are: wave (iii) green is 22.7 points short of equality with wave (i) green (an acceptable Fibonacci ratio as the variation is less than 10%), and wave (v) green is just 1.91 points longer than 0.618 the length of wave (iii) green.
Ratios within wave (iii) green are: wave iii orange has no Fibonacci ratio to wave i orange, and wave v orange is just 3.14 points short of 0.382 the length of wave iii orange.
Ratios within wave (v) green are: there is no Fibonacci ratio between waves iii and i orange, and wave v orange is just 0.11 points longer than 0.236 the length of wave iii orange.
So far upwards movement to end the trading week looks most easily like a five wave structure which is either complete or very close to completion on the 5 minute chart.
Ratios within wave (a) green are: wave iii orange has no Fibonacci ratio to wave i orange, and wave v orange is 3.57 points longer than 0.236 the length of wave iii orange.
We may draw a best fit parallel channel about wave (a) green. When this channel is breached by downwards movement then wave (b) green should be underway. Wave (b) green should subdivide into a three wave structure or a triangle, and may not move beyond the start of wave (a) green. In the short term this wave count is invalidated with movement below 12,492.33.
When wave (b) green is a complete three then redraw the channel to contain all of wave ii pink. Draw the first trend line from the start of wave (a) green to wherever wave (b) green has ended. Place a parallel copy upon the high of wave (a) green. Expect wave (c) green to end about the upper edge of the channel or possibly to overshoot it.
Wave ii pink may not move beyond the start of wave i pink. This wave count is invalidated with movement above 12,961.3.
When wave ii pink is complete we shall expect strong downwards movement for a third wave. Wave ii pink may end sometime towards the end of next week.
Alternate Hourly Wave Count.
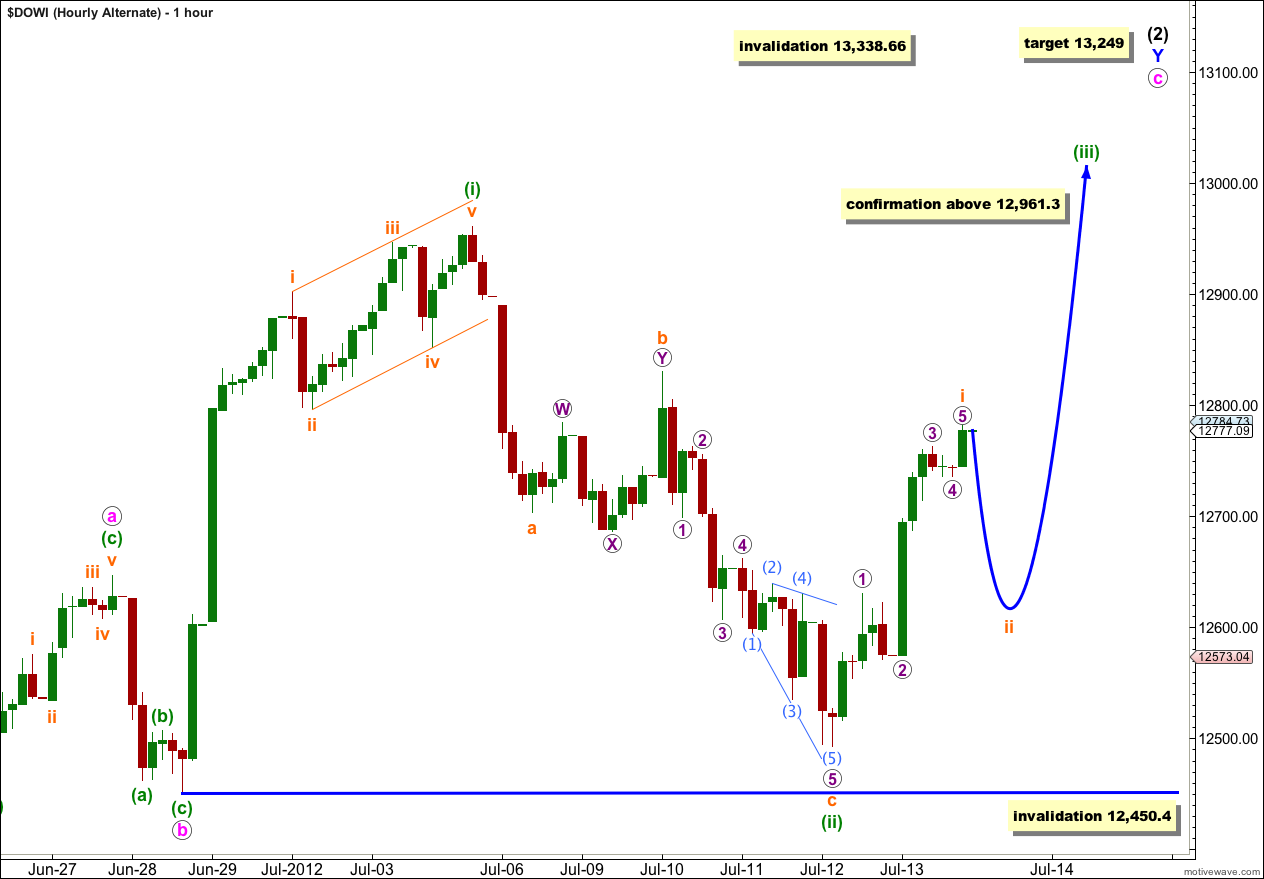
Because downwards movement did not breach 12,450.4 this wave count remains viable, but it looks odd at this stage.
It is possible to see downwards movement ending at the low of wave (ii) green as a three wave zigzag, and overall this does have a three wave look on the hourly chart.
Waves a and c orange have no Fibonacci ratio to each other. Within wave c orange there are no adequate Fibonacci ratios between waves 1, 3 and 5 purple. The lack of Fibonacci ratios reduces the probability of this wave count a little.
In the short term this alternate expects the same movement to start next week: a three wave structure downwards for a second wave correction then a five wave impulse upwards for a third wave. If this wave count is correct then it should be confirmed next week with movement above 12,961.3.
At 13,249 wave c pink would reach 4.236 the length of wave a pink. This is the mid term target for this wave count.