
Yesterday’s analysis expected the S&P 500 to begin Tuesday’s session with upwards movement to at least 1,357. Price rose to 1,361.54, before falling, and thereafter the main and alternate wave counts diverged.
I still have only one daily wave count with two hourly wave counts. We may know about the end of this week which wave count is correct.
At this stage both hourly wave counts expect exactly the same movement for tomorrow’s session.
Click on the charts below to enlarge.
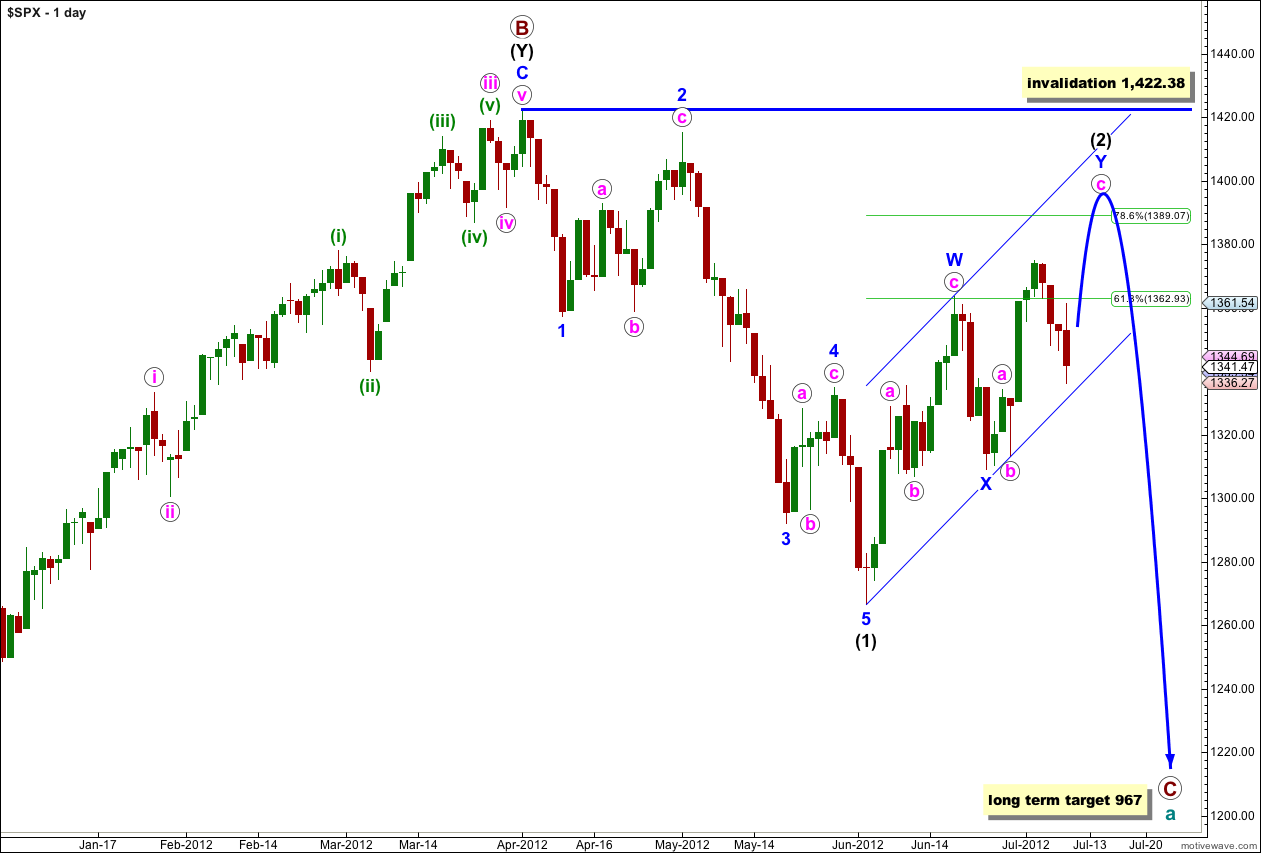
This wave count sees a big trend change at the price high of 1,422.38. Primary wave C should make substantial new lows below the end of primary wave A which had its low at 1,074.77. Primary wave C would reach 1.618 the length of primary wave A at 967, completing a typical expanded flat for cycle wave a.
Within primary wave C wave (1) black is a complete five wave impulse downwards. Wave (2) black is unfolding as a double zigzag structure. The purpose of a double zigzag is to deepen a correction. At this stage the final structure of wave Y blue, the second zigzag, may be either complete or is still a few days away from completion.
Wave (2) black may not move beyond the start of wave (1) black. This wave count is invalidated with movement above 1,422.38.
I have the same two hourly wave counts today which look at this most recent movement differently.
Main Hourly Wave Count.
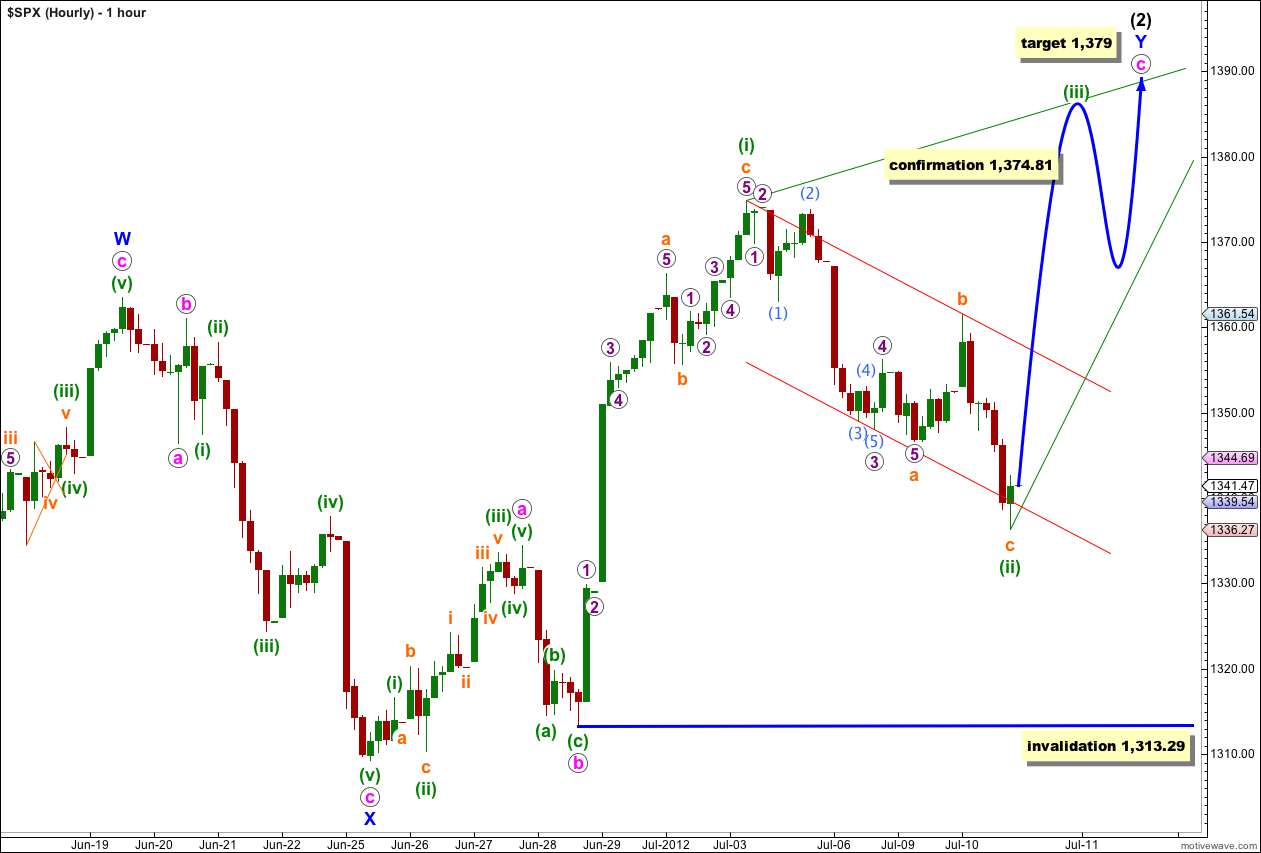
Only because we should always assume that the trend remains the same, until proven otherwise, do I have this as the main wave count today. While price remains above 1,313.29 we shall not have confirmation of a trend change.
It remains possible (but now looks less likely) that wave c pink upwards may continue higher as an ending diagonal. Wave (ii) green should now be over as a zigzag structure. This wave count now requires upwards movement in another zigzag for wave (iii) green which must make a new high above the end of wave (i) green at 1,374.81.
Within wave (ii) green there is no adequate Fibonacci ratio between waves a and c orange.
Ratios within wave a orange are: wave 3 purple has no Fibonacci ratio to wave 1 purple, and wave 5 purple is 0.4 points short of 0.382 the length of wave 1 purple.
Within wave 3 purple there are no adequate Fibonacci ratios.
At 1,379 wave c pink would reach 2.618 the length of wave a pink. However, this target may be too low. When waves (iii) and (iv) green are complete then a final target for wave (v) green to end wave c pink may be calculated. Wave (v) green should end at the trend line connecting the highs of waves (i) and (iii) green.
Wave (ii) green may not move beyond the start of wave (i) green. This wave count is invalidated with movement below 1,313.29.
Alternate Hourly Wave Count.
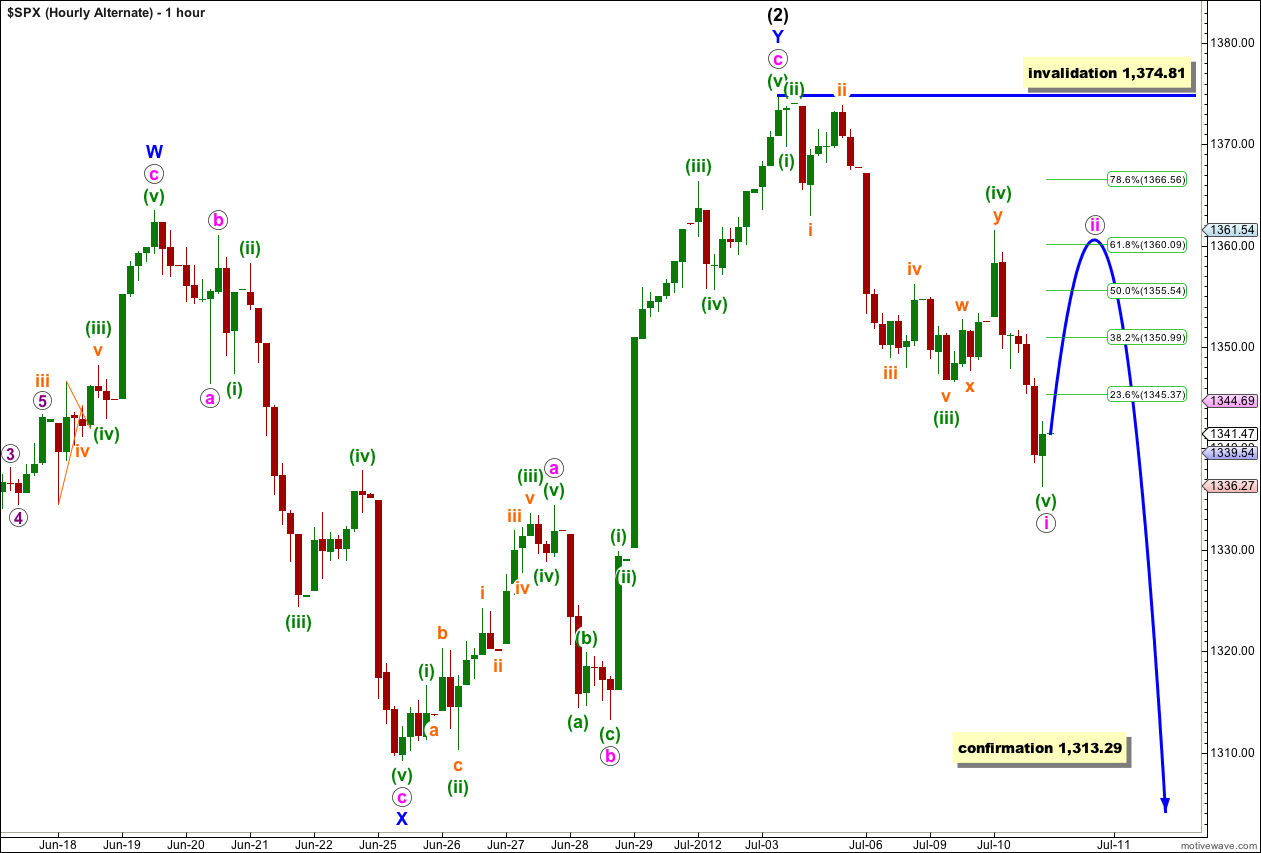
We now have a possible five down on the hourly chart and this slightly increases the probability of this alternate wave count. However, it remains unconfirmed. If the parallel channel drawn today on the daily chart is breached then this wave count will further increase in probability.
Ratios within wave i pink are: wave (iii) green has no Fibonacci ratio to wave (i) green, and wave (v) green is 2.09 points short of equality with wave (iii) green.
Ratios within wave (iii) green are: wave iii orange has no Fibonacci ratio to wave i orange, and wave v orange is just 0.02 points longer than 0.382 the length of wave iii orange.
If this downwards movement is a five then the next movement should be upwards for a second wave correction. Wave ii pink would be most likely to end about the 0.618 Fibonacci ratio of wave i pink at 1,360.
Wave ii pink may not move beyond the start of wave i pink. This wave count is invalidated with movement above 1,374.81.