
Last week’s analysis had two hourly wave counts with a differentiating price point at 12,898.94. This price point was quickly passed at the open of the trading week invalidating the main hourly wave count and confirming the alternate.
The alternate wave count expected further upwards movement to a target of 12,944. Price moved overall higher during the week to reach to 12,961.3, 17.3 points above the target. Thereafter, price turned back downwards.
For the next trading week I again have two hourly wave counts for you.
Click on the charts below to enlarge.
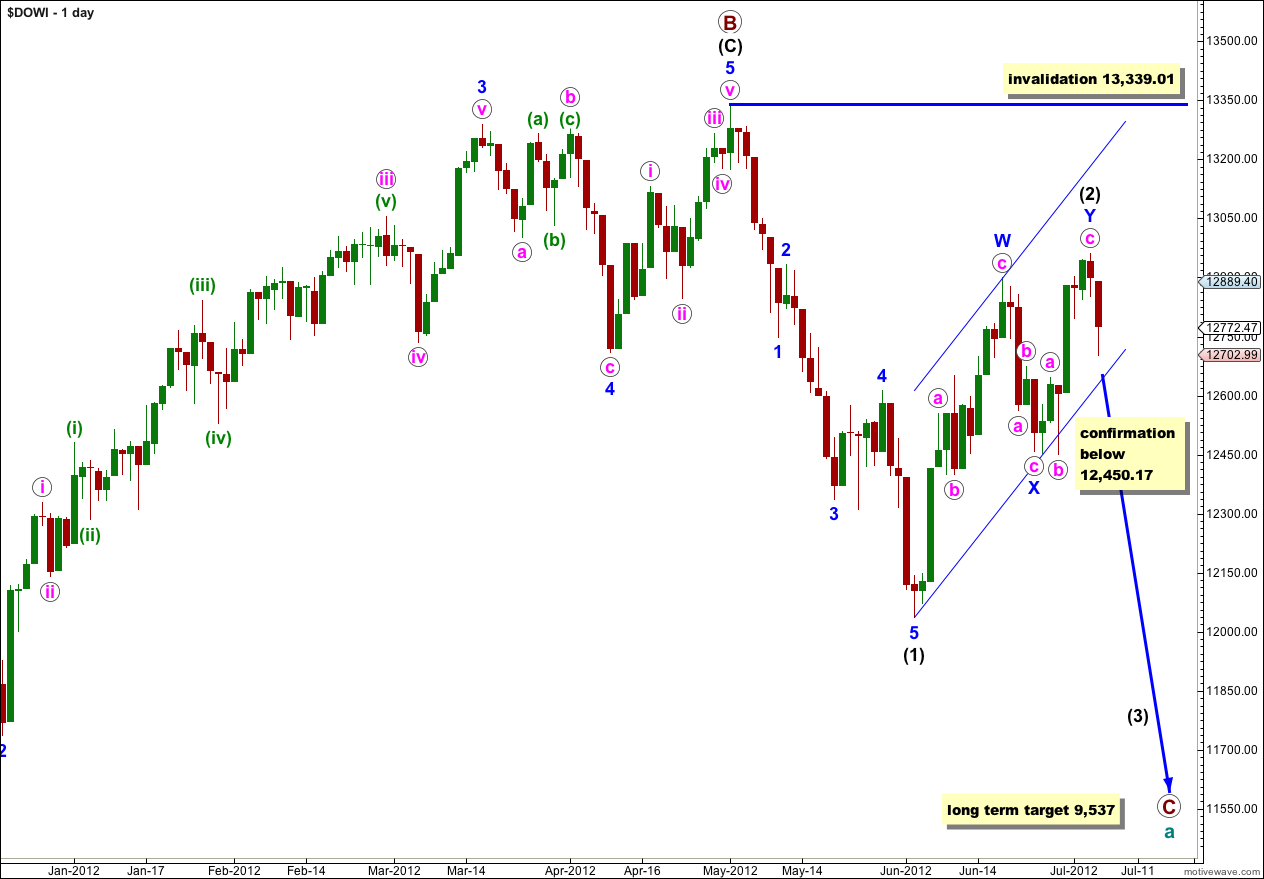
Wave (2) black may be complete again as a double combination correction, but it is important to wait for confirmation of this large trend change before we can have confidence that wave (3) black downwards has begun. When we have confirmation then I will calculate a target for wave (3) black. To do so prior to confirmation would be premature.
At this stage the price point of 12,450.4 is the only price point which would confirm a trend change, from the end of wave (2) black to the start of wave (3) black downwards. This would also bring price outside the parallel channel containing wave (2) black upwards adding further confidence to the trend change.
I have two hourly wave counts. The first sees wave (2) black as incomplete because we should always assume that the trend remains the same until proven otherwise. The alternate looks at wave (2) black as complete and it looks best on the daily chart. These two wave counts have an even probability.
Cycle wave a is an expanded flat because primary wave B within it is over 105% the length of primary wave A. An expanded flat expects a C wave to move substantially beyond the end of the A wave. At 9,537 primary wave C would achieve this and would be a typical 1.618 the length of primary wave A.
Main Hourly Wave Count.
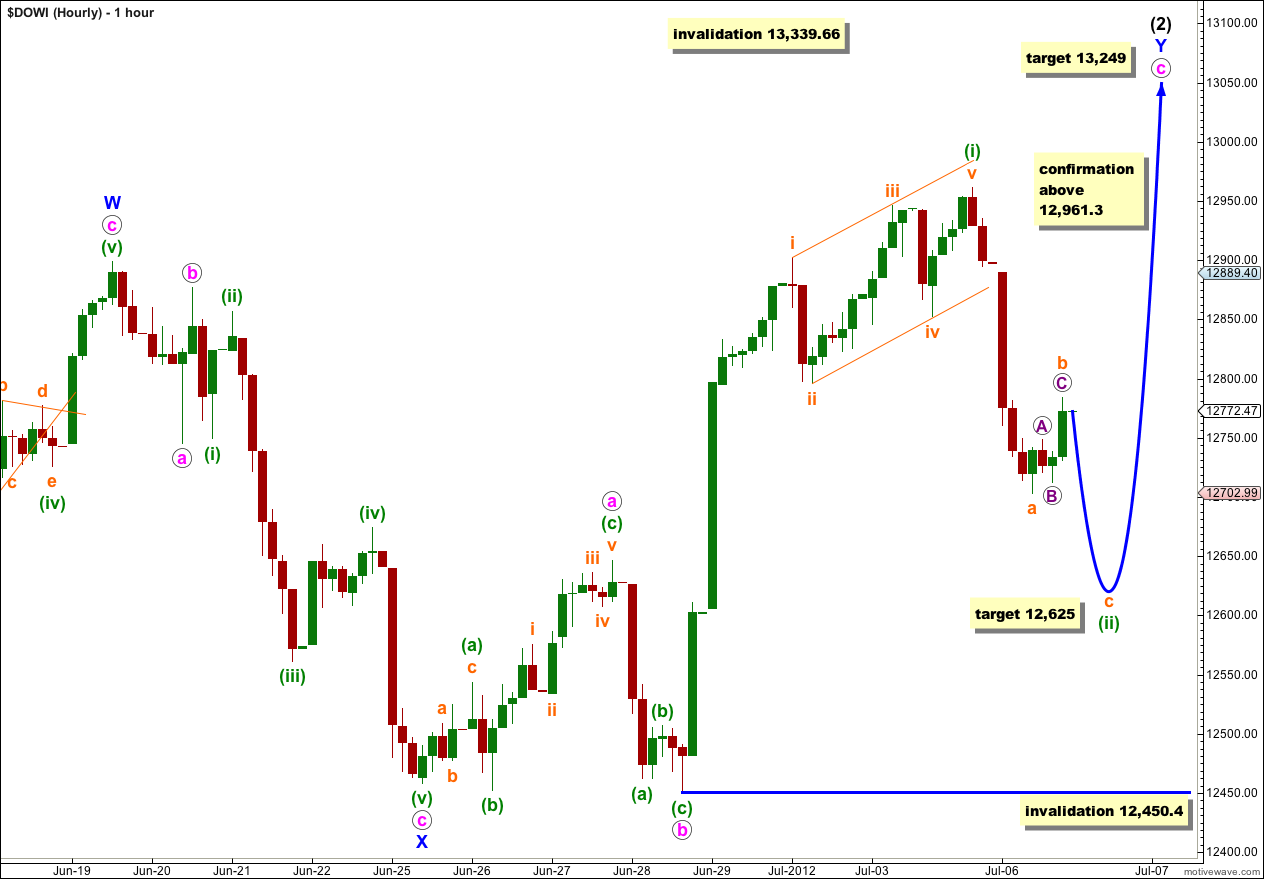
We should always assume that the trend remains the same until proven otherwise. At this stage we do not have confirmation of a trend change and we should assume the trend remains upwards.
Within wave c pink wave (i) green may have completed a leading contracting diagonal. On the 5 minute chart all of the subwaves within wave (i) green subdivide most easily into zigzags.
So far wave (ii) green is most likely not over because downwards movement labeled wave a orange within (ii) green is most easily seen as a five wave impulse on the 5 minute chart. Upwards movement for wave b orange is fairly likely to be complete as a zigzag with wave C purple just 0.8 points short of 1.618 the length of wave A purple.
At 12,625 wave c orange would reach 0.618 the length of wave a orange. This would complete a zigzag for a deep second wave correction (following a leading diagonal in a first wave position we would expect to see a very deep second wave). If price passes through this first target then the next calculated target for wave (ii) green to end would be at 12,526 where wave c orange would reach equality with wave a orange.
Wave (ii) green may not move beyond the start of wave (i) green. This wave count is invalidated with movement below 12,450.4.
Movement above 12,961.3 would confirm this wave count as the alternate below would be invalidated. At that stage we would use the target at 13,249 where wave c pink would reach 4.236 the length of wave a pink.
Alternate Hourly Wave Count.
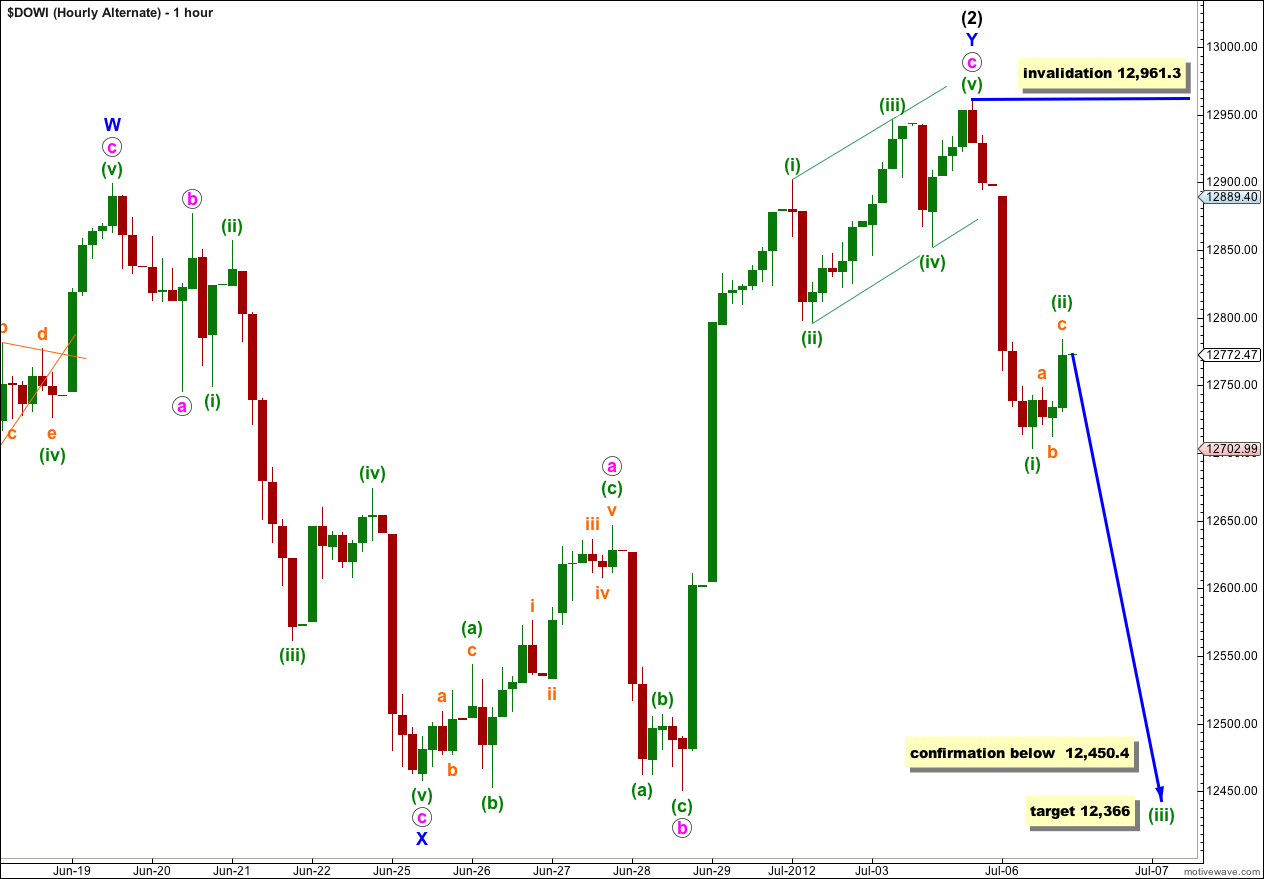
By simply moving everything within wave c pink up one degree we see it may have been an ending contracting diagonal. Wave (2) black may be over.
If this alternate is correct then wave (ii) green may not move beyond the start of wave (i) green. This wave count is invalidated with movement above 12,961.3.
At 12,450.4 this wave count would be confirmed.
At 12,366 wave (iii) green would reach 1.618 the length of wave (i) green.
If this alternate is correct then the momentum of a third wave downwards should confirm it early to mid next week. If it is not confirmed next week then its probability will be significantly reduced.