
Yesterday’s analysis said to expect overall choppy, overlapping, sideways movement for another couple of sessions or longer. Price has moved upwards for Thursday’s session in a choppy overlapping three wave movement and remains range bound. This is pretty much what I was expecting.
Today I have three hourly wave counts. At this stage in the correction multiple options are possible. One by one they will be eliminated until again we have just one wave count. At this stage all three hourly charts expect the same direction for tomorrow’s movement.
Click on the charts below to enlarge.
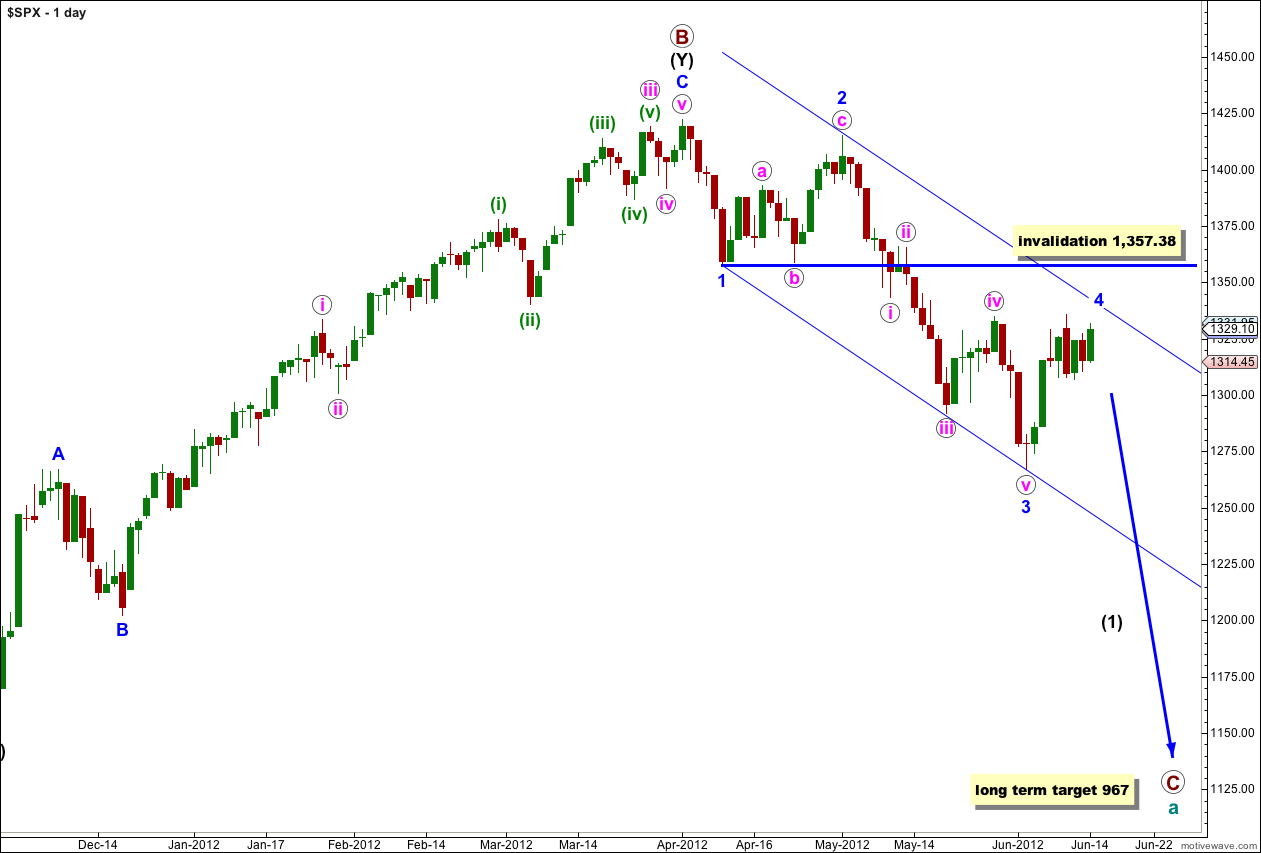
We have recently seen a very large trend change on the S&P 500 and a new downwards trend, to last months, has begun.
At cycle degree wave a (teal green) is an expanded flat correction. Primary wave A (maroon) within it subdivides into a three, and primary wave B is over 105% of primary wave A at 123%. The minimum requirements for an expanded flat are met. We should expect primary wave C to subdivide into a five and move price substantially below the end of primary wave A at 1,074.77.
At 967 primary wave C would reach 1.618 the length of primary wave A. If price continues through this first target, or it gets there and the structure is incomplete, then our second (less likely) target is at 685 where primary wave C would reach 2.618 the length of primary wave A.
Primary wave A lasted 4 months. Primary wave B lasted 6 months. We may expect primary wave C to last at least 4 months, if not longer.
Wave 4 blue may not move into price territory of wave 1 blue. This wave count is invalidated with movement above 1,357.38.
First Hourly Wave Count.
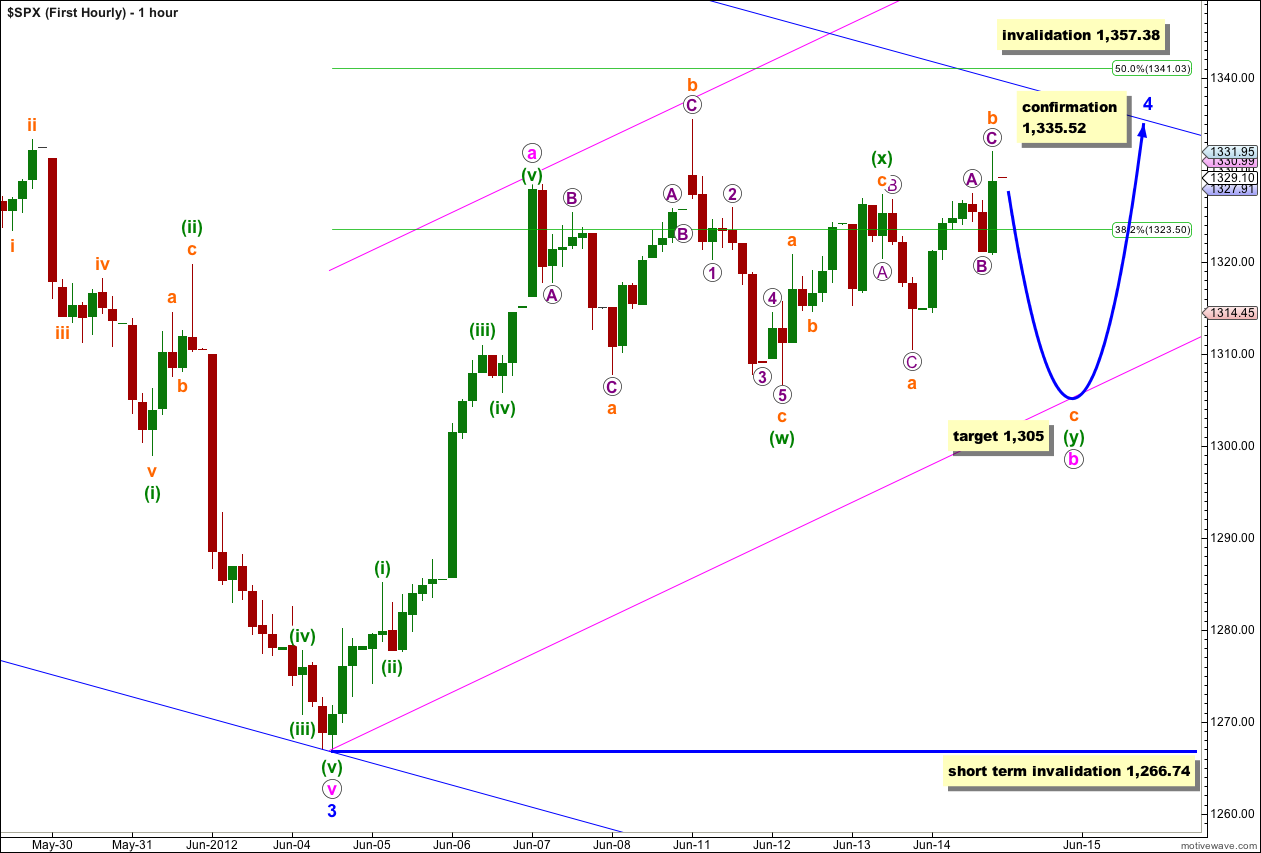
This wave count follows on directly from yesterday’s main hourly chart. It expects that wave b pink within 4 blue is continuing sideways as a double correction, and after Thursday’s session it would most likely be a double flat.
Wave (y) green may be unfolding as a flat correction. Wave a orange can be seen as a three on the five minute chart. Wave b orange is a clear three and is a 128% correction of wave a orange. At 1,305 wave c orange would be 1.618 the length of wave a orange. Wave c orange must subdivide into a five wave structure.
This target fits with the overall look of a double flat which has the purpose of moving price sideways to take up time.
Wave c orange should take one or possibly two sessions to unfold.
It is extremely likely that wave c orange would take price below the end of wave a orange at 1,310.51 to avoid a rare running flat.
Wave b pink may not move beyond the start of wave a pink. This wave count is invalidated with movement below 1,266.74.
Second Hourly Wave Count.
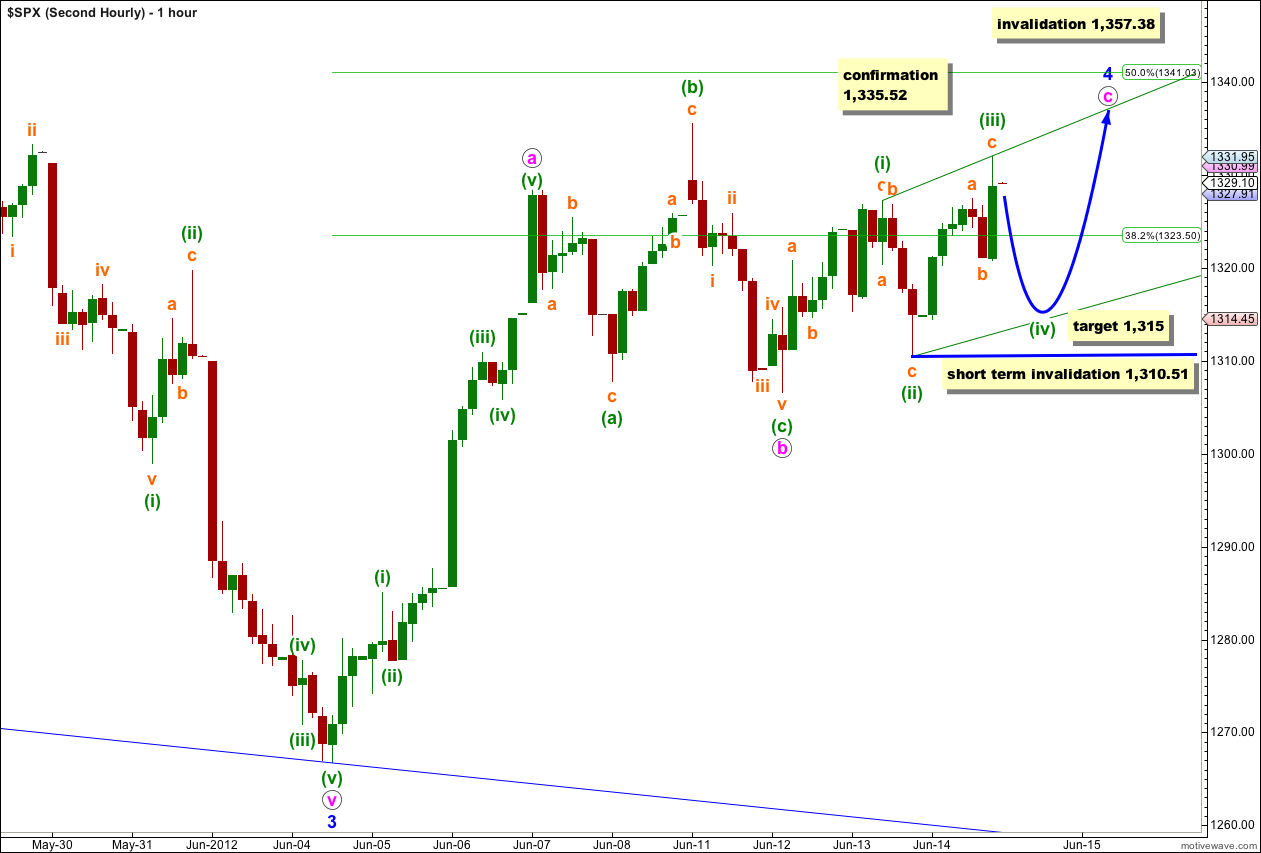
It is also possible that waves a and b pink are both complete. So far sideways movement of the last three sessions is moving price slightly higher, and this may be an ending diagonal for wave c pink.
Ending diagonals require all subwaves to subdivide as zigzags. Wave (iv) green of the diagonal must move into wave (i) green price territory, but it may not move beyond the end of wave (ii) green below 1,310.51.
The price point which differentiates this second hourly chart from the first is 1,310.51. The first hourly wave count sees movement below this point as extremely likely, and this alternate sees it as unlikely. The depth of the next downwards wave should illustrate which wave count is correct between these two.
The diagonal would probably be expanding as wave (iii) green is slightly longer than wave (i) green (however, I have often seen diagonals with third waves still the longest). Wave (iv) green would be likely to be longer than wave (ii) green taking it to just below the target at 1,315.
Thereafter, a final zigzag upwards for wave (v) green to complete the diagonal should unfold.
Third Hourly Wave Count.
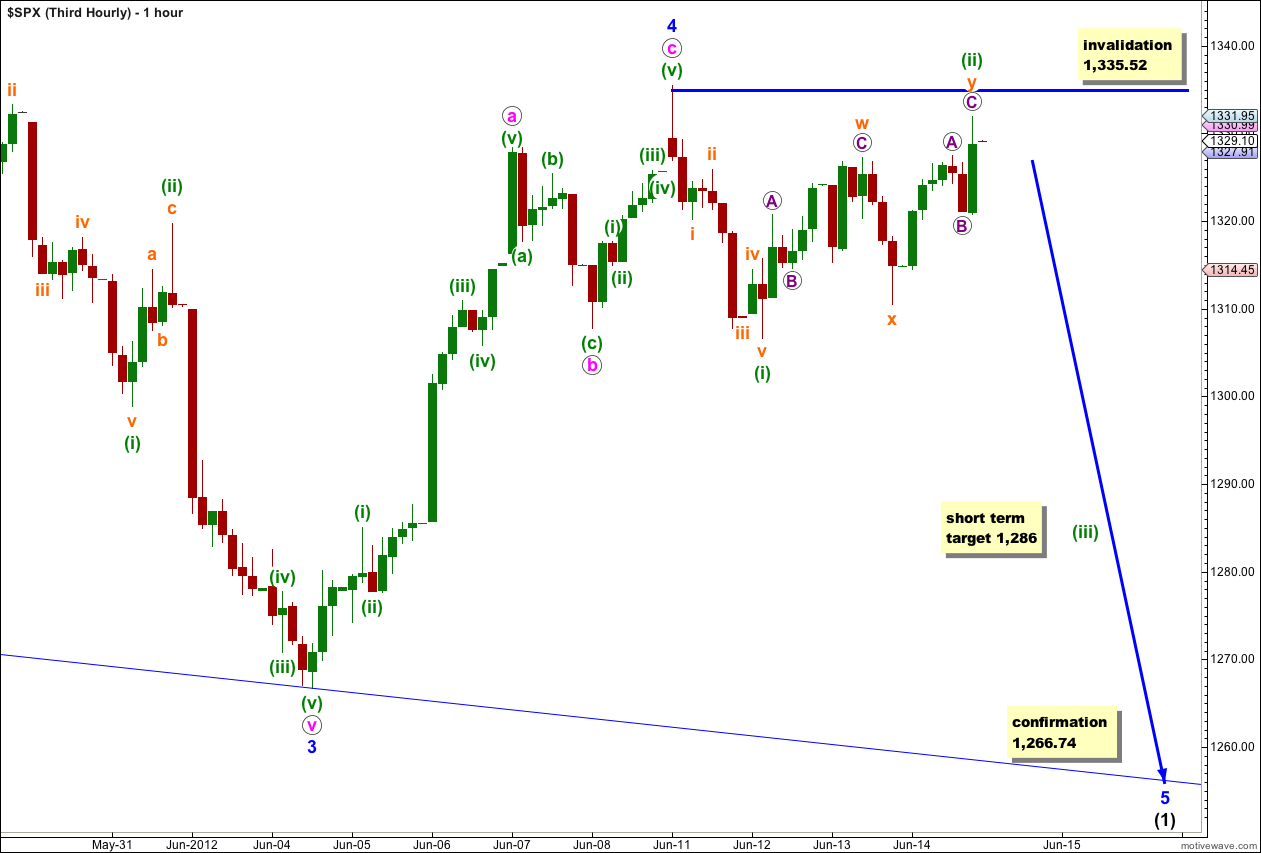
This third wave count follows on directly from yesterday’s alternate hourly wave count.
It remains possible, while price remains below 1,335.52, that wave 4 blue is complete as a very brief shallow zigzag.
Within wave v pink waves (i) and (ii) green may be over. Wave (ii) green may have extended higher as a double zigzag.
This wave count has the lowest probability. It is unlikely that wave 4 blue was as brief as 5 days. It is unlikely that wave (ii) green is so long lasting in comparison to wave (i) green. Overall at this stage this wave count does not have quite the right look anymore.
Wave (iii) green would now reach 1.618 the length of wave (i) green at 1,286.
Wave (ii) green may not move beyond the start of wave (i) green. This wave count is invalidated with movement above 1,335.52.
This wave count would be confirmed with price movement below 1,266.74 as at that stage the first two hourly charts would be invalidated.
Alternate Daily Wave Count.
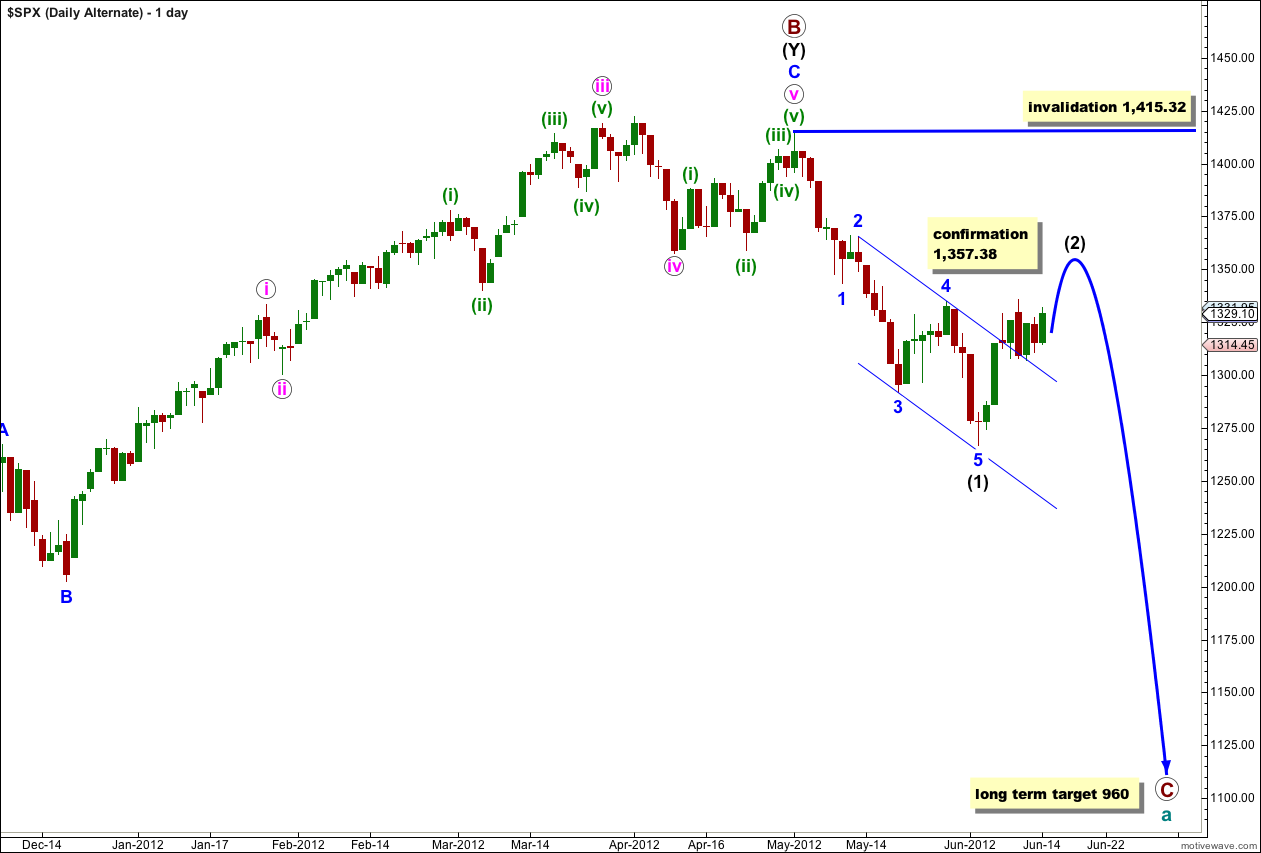
Primary wave B may have ended at 1,415.32 with a fifth wave truncation. The truncation reduces the probability of this alternate.
Wave (1) black is complete. This alternate now expects a second wave correction for wave (2) black. Wave (2) black can move right up to, but not above, 1,415.32.
This wave count diverges from our main wave count. The price point which differentiates the two is 1,357.38. The main wave count would not allow movement above that price point and this alternate sees it as reasonably likely. If price did move above 1,357.38 the main wave count would be invalidated and this alternate would be our sole wave count.
This alternate wave count expects a more long lasting and deeper correction than our main wave count. If this alternate is correct then intermediate wave (2) may last at least 4 weeks and possibly longer.
Wave (2) black may not move beyond the start of wave (1) black. This wave count is invalidated with movement above 1,415.32.