
Last week’s analysis expected overall upwards movement from the Dow to continue a correction for a second wave. Price has moved higher, beyond the first target, and is nearing the second target.
I still have one daily and one hourly chart for the Dow this week.
Click on the charts below to enlarge.
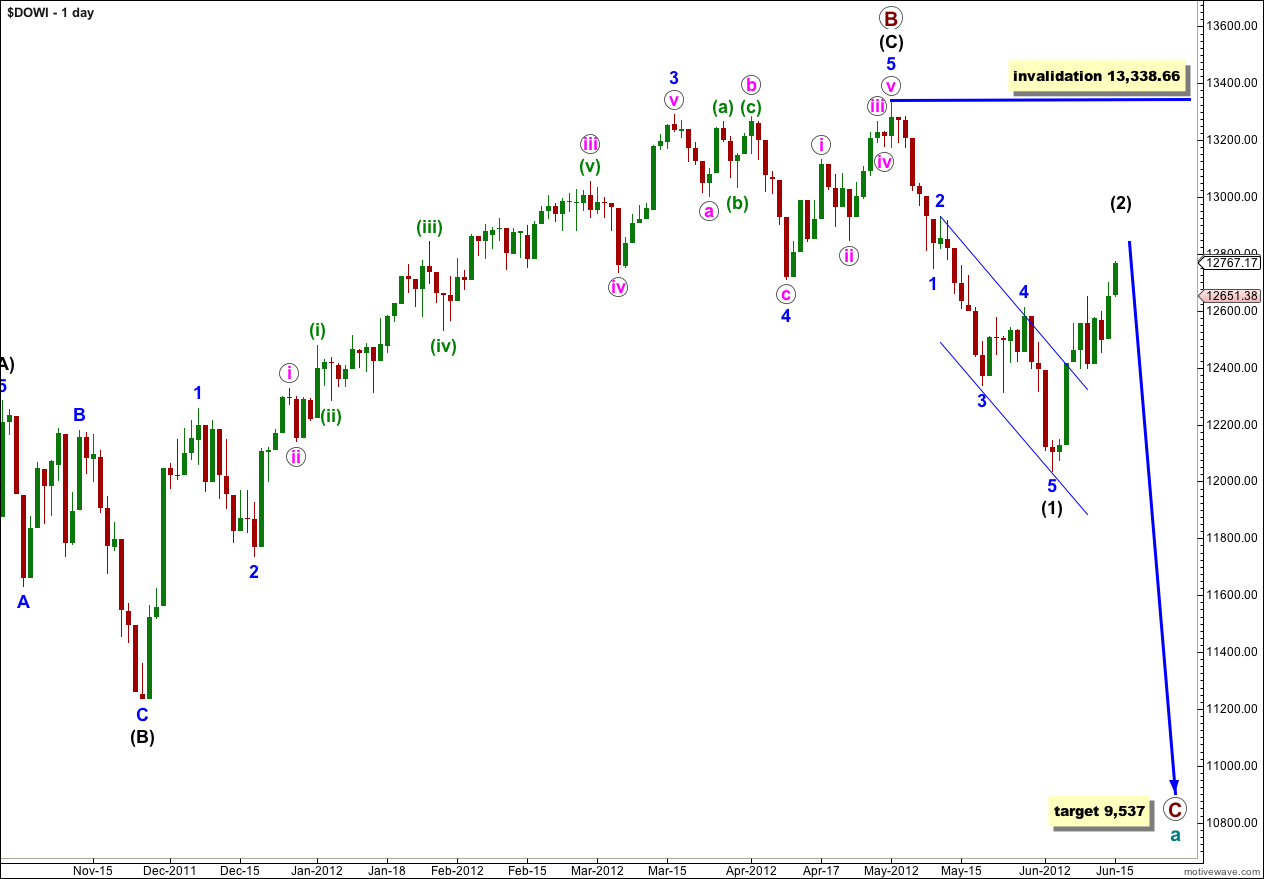
Recent upwards movement is a second wave zigzag correction for (2) black. This structure on the hourly chart is incomplete and requires more upwards movement before it is over. When it is over (and the end may be next week) we should expect a strong third wave downwards to begin.
Wave (2) black may move right up to the start of wave (1) black at 13,338.66, but not beyond. Movement above this point would invalidate the wave count.
Cycle wave a is an expanded flat because primary wave B within it is over 105% the length of primary wave A. An expanded flat expects a C wave to move substantially beyond the end of the A wave. At 9,537 primary wave C would achieve this and would be a typical 1.618 the length of primary wave A.
Second waves can, and often do, correct to very deep degrees. When they are deep corrections they convince us that there has been no trend change and that we are going to see new price extremes, and they do this right before a strong third wave takes off in the opposite direction. As price moves higher next week keep this tendency in mind.
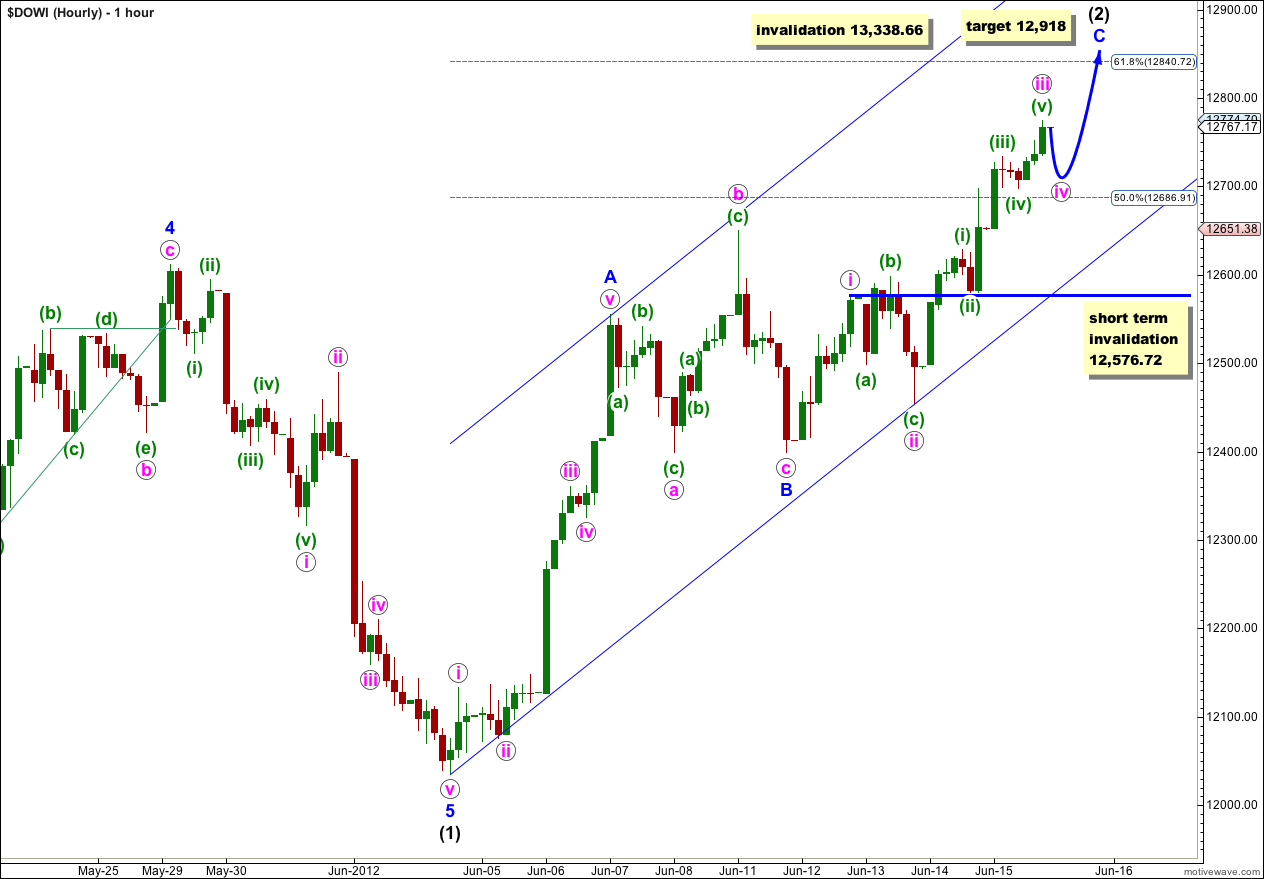
To start the trading week the hourly chart was invalidated by 0.12 of a point with slightly lower downwards movement. My labeling of B blue within (2) black as complete was premature; it has moved lower to complete a flat correction.
I have redrawn the parallel channel about (2) black as a best fit. When this channel is clearly breached by downwards movement then the upwards zigzag correction is over and the next wave down would be underway.
At that stage we still need to see a clear five downwards on the hourly chart to confirm (2) black as complete. If we only see a three down then it may be an X wave if (2) black is continuing further as a double zigzag or double combination.
Within this upwards zigzag wave C blue is incomplete. It must subdivide into a five and here it looks like it is an impulse.
At 12,918 wave C blue would reach equality with wave A blue. This is our target for upwards movement to end.
Within wave C blue wave iv pink may not move into wave i pink price territory. This wave count is invalidated in the short term with movement below 12,576.72 (before v pink upwards completes).