
The Dow did not move as low as I had expected. Price fell 15 points short of the short term target, and got nowhere near the long term target before turning upwards to breach the invalidation point on the hourly chart.
I have reanalysed downwards movement from the high of 13,338.66. This upwards movement to end the trading week is a correction but it is two wave degrees higher than the small correction I was expecting.
I still have just one daily and one hourly wave count this week.
Click on the charts below to enlarge.
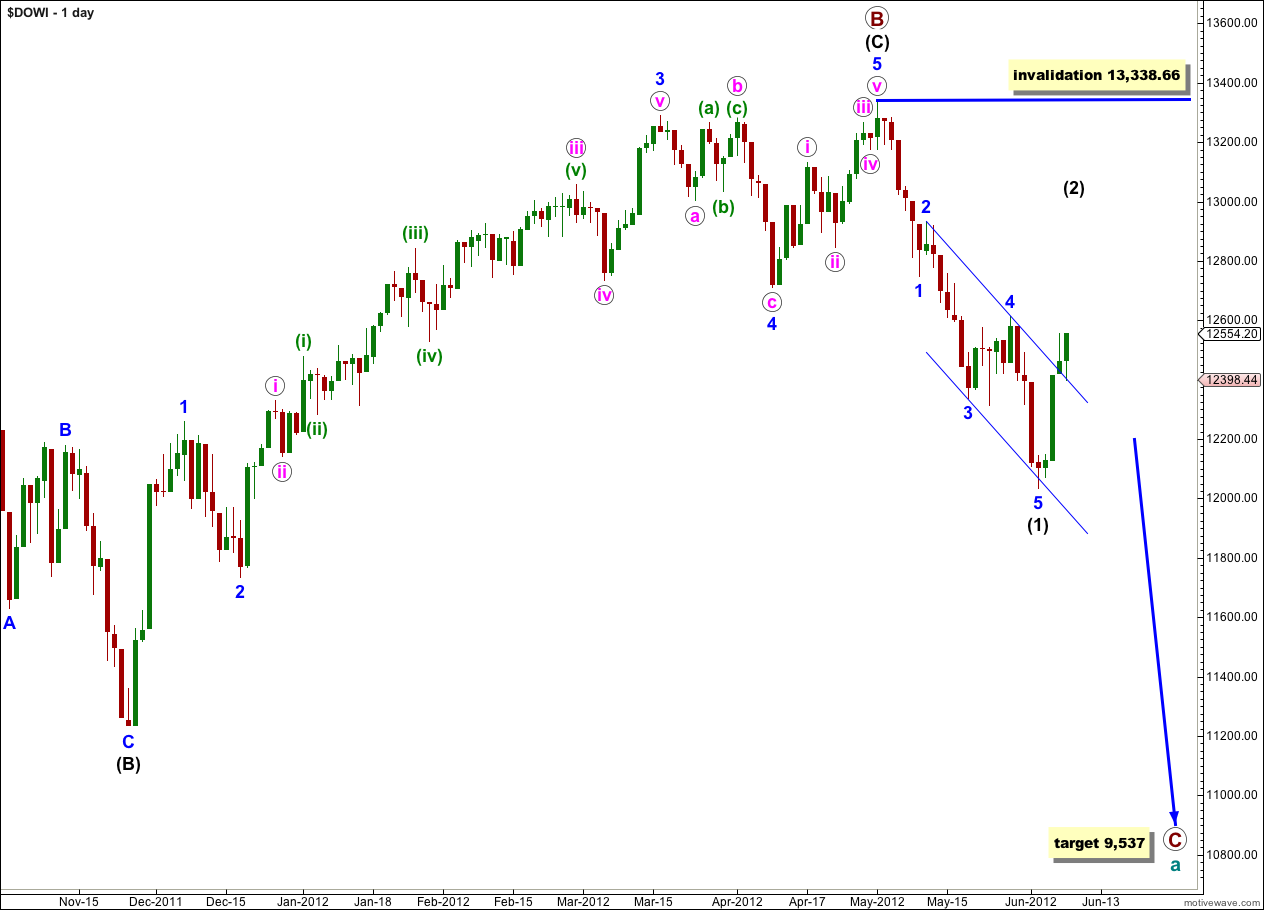
With price movement above 12,489.87 this upwards movement cannot be a low degree fourth wave correction. Downwards movement must be over and this upwards movement must be wave (2) black which has arrived a lot earlier than I anticipated.
Ratios within wave (1) black are: wave 3 blue is just 4.77 points longer than equality with wave 1 blue, and wave 5 blue has no Fibonacci ratio to either of 1 or 3 blue.
A parallel channel drawn using Elliott’s technique about wave (1) black is breached by upwards movement. The downwards wave is over and the upwards correction is underway.
Wave (2) black may move right up to the start of wave (1) black at 13,338.66, but not beyond. Movement above this point would invalidate the wave count.
Cycle wave a is an expanded flat because primary wave B within it is over 105% the length of primary wave A. An expanded flat expects a C wave to move substantially beyond the end of the A wave. At 9,537 primary wave C would achieve this and would be a typical 1.618 the length of primary wave A.
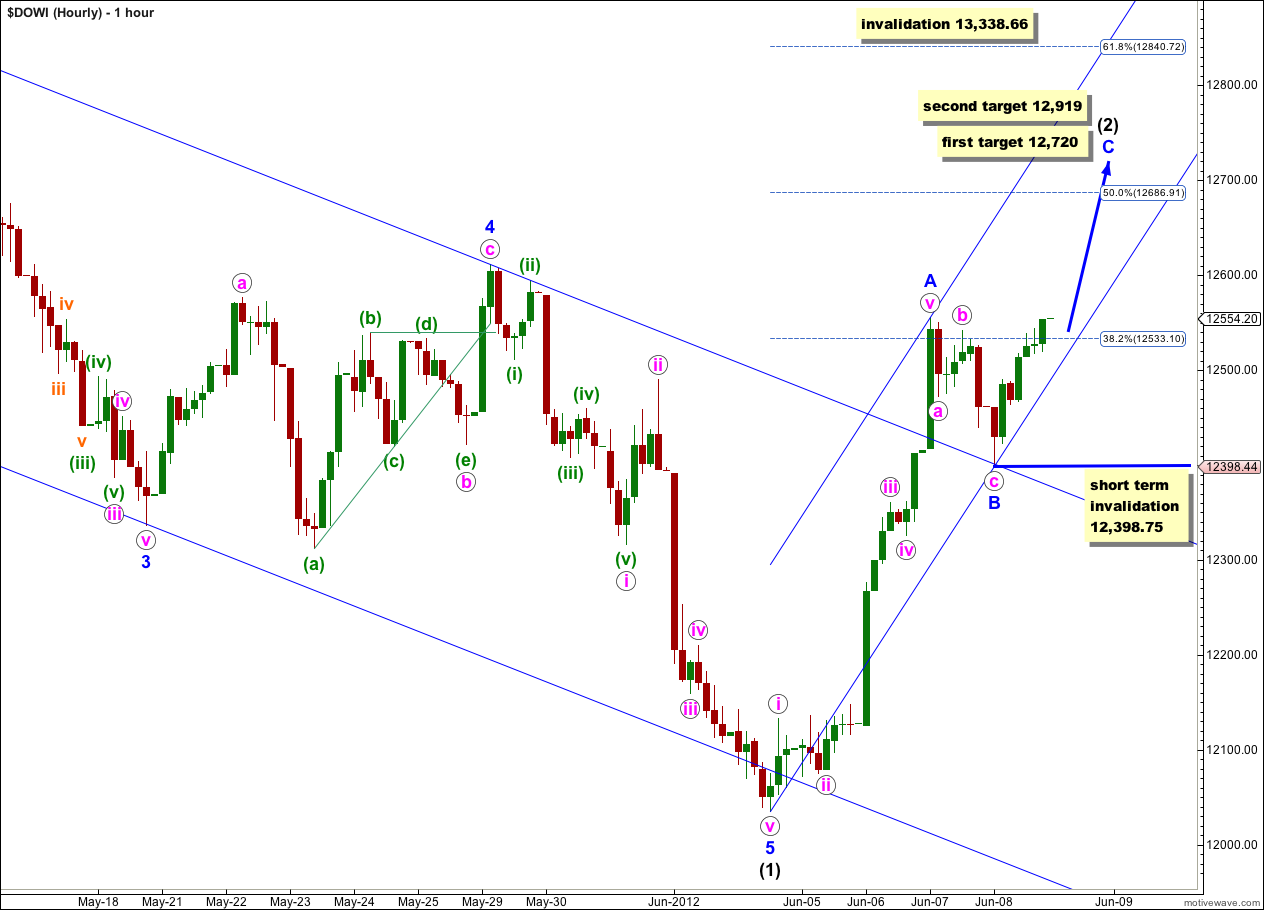
Within wave (2) black so far upwards movement looks impulsive, which indicates the correction is incomplete.
Within wave A blue there are no Fibonacci ratios between waves i, iii and v pink.
Wave B blue is a clear three wave structure which is most likely over.
At 1,270 wave C blue would reach 0.618 the length of wave A blue. If price rises through this first target, or it gets there and the structure for wave C blue is incomplete, then the next target is at 12,919 where wave C blue would reach equality with wave A blue.
When markets open on Monday no second wave correction may move beyond the start of the first wave within wave C blue. This wave count is invalidated in the short term (before wave C blue is complete) with movement below 12,398.75.
When wave C blue is complete then we have to consider the alternate possibility that wave (2) black may continue further as a double zigzag or double combination. This is a reasonable possibility because so far wave (2) black has been very brief. This first zigzag may be only the first of two structures to unfold for wave (2) black.
Draw a parallel channel about this upwards zigzag using Elliott’s technique. Wave C blue may end about the upper edge of this channel. When the channel is breached by downwards movement then the zigzag is over and the next wave downwards is underway.
When this first zigzag is over then we must be able to see a clear five down on the hourly chart to confirm that wave (2) black is over. If only a three down follows it then the could be a zigzag for an X wave within a double.
Second waves can, and often do, correct to very deep degrees. When they are deep corrections they convince us that there has been no trend change and that we are going to see new price extremes, and they do this right before a strong third wave takes off in the opposite direction.