
Last analysis expected “new lows with increasing momentum” for Friday’s session which is exactly what happened.
This wave count continues to explain price action nicely. I expect short and mid term targets to be met next week.
I still have two daily wave counts which do not at this stage diverge in expectations for what should happen next, and only one hourly wave count.
Click on the charts below to enlarge.
We have recently seen a very large trend change on the S&P 500 and a new downwards trend, to last months, has begun.
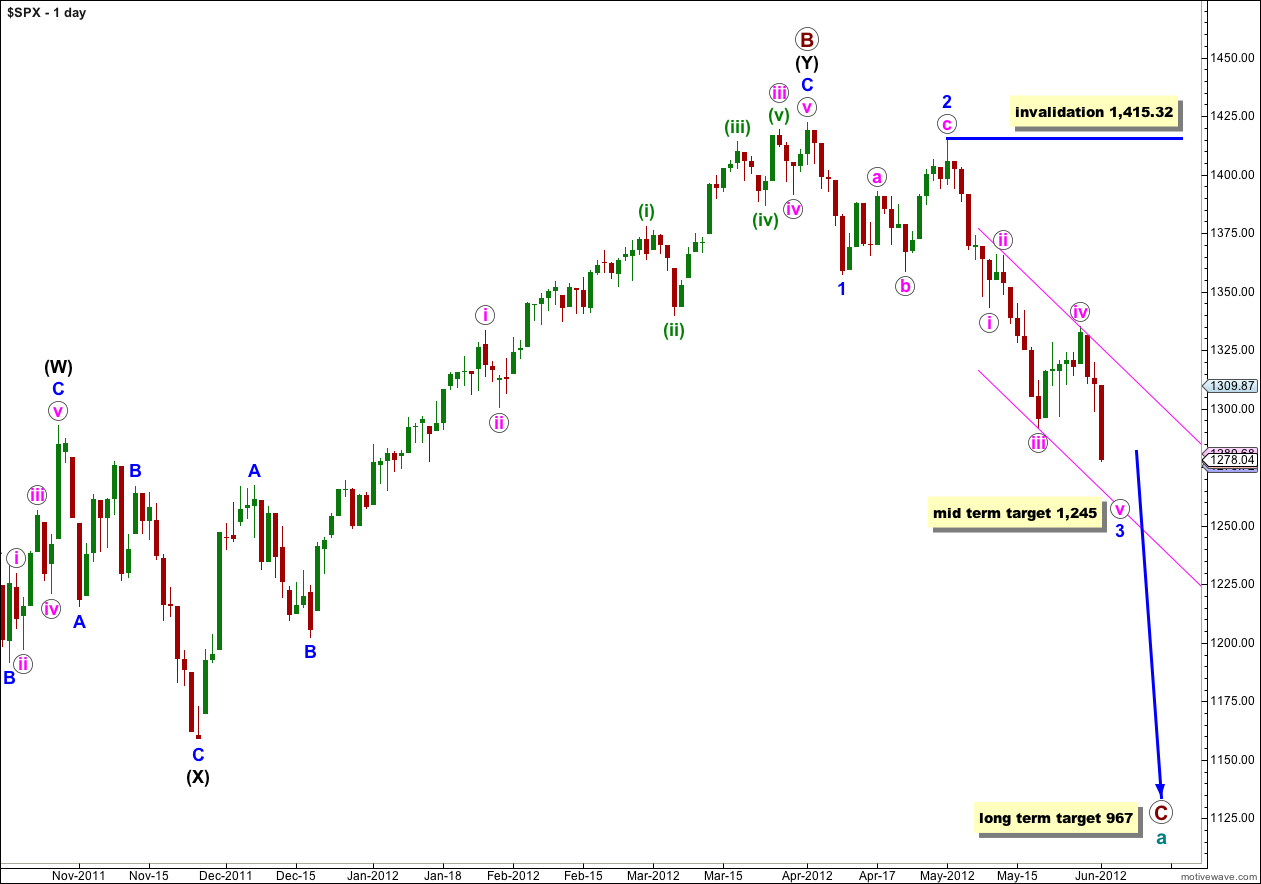
At cycle degree wave a (teal green) is an expanded flat correction. Primary wave A (maroon) within it subdivides into a three, and primary wave B is over 105% of primary wave A at 123%. The minimum requirements for an expanded flat are met. We should expect primary wave C to subdivide into a five and move price substantially below the end of primary wave A at 1,074.77.
At 967 primary wave C would reach 1.618 the length of primary wave A. If price continues through this first target, or it gets there and the structure is incomplete, then our second (less likely) target is at 685 where primary wave C would reach 2.618 the length of primary wave A.
Primary wave A lasted 4 months. Primary wave B lasted 6 months. We may expect primary wave C to last at least 4 months, if not longer.
Within wave 3 blue no second wave correction may move beyond the start of the first wave. This wave count is invalidated with movement above 1,415.32. When the structure of wave 3 blue is complete then the invalidation point can be moved to the low of wave 1 blue at 1,357.38.
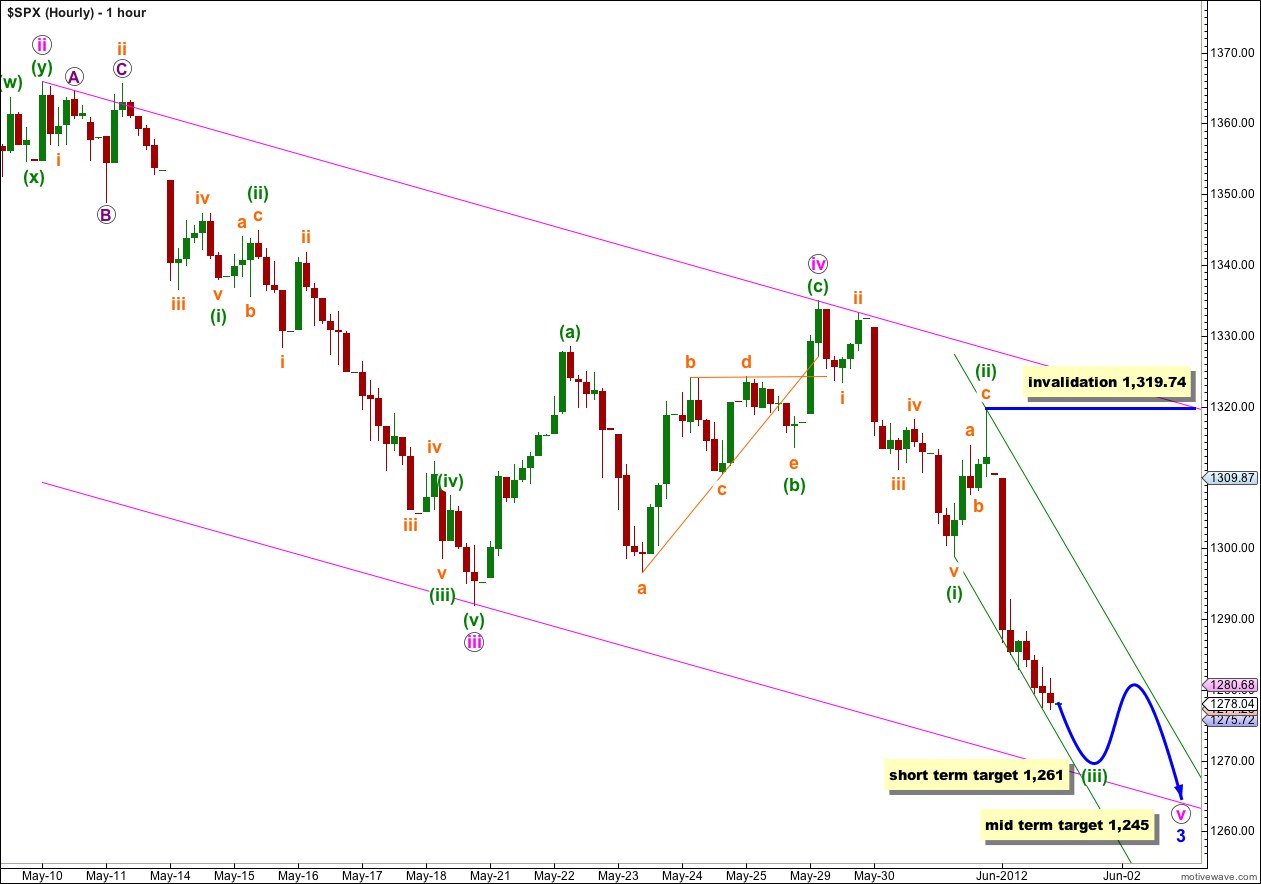
As expected we saw downwards movement with increased momentum during Friday’s session. The short term target could be met during Monday’s session.
At 1,261 wave (iii) green would reach 1.618 the length of wave (i) green. On the 5 minute chart so far wave (iii) green does not look complete. I suspect that it may actually be about to enter the middle of this third wave and if that is the case we may see a further increase in downwards momentum on Monday and the target may be too conservative. I may recalculate the target lower after Monday’s session.
At 1,245 wave 3 blue would reach 2.618 the length of wave 1 blue (seen on the daily chart). Because wave 3 blue has already passed 1.618 the length of wave 1 blue this would be the next target to calculate.
The pink parallel channel is drawn about wave 3 blue using Elliott’s second channeling technique. The first trend line is drawn from the highs labeled ii to iv pink, then a parallel copy is placed upon the low of wave iii pink. Wave v pink looks like it will end about the lower edge of this parallel channel. If the channel is overshot then I would consider a reanalysis of wave 3 blue, and it could be that wave iii pink within wave 3 blue would be extending further. I will consider that possibility if necessary next week. Either way, next week should see new lows.
When wave (iii) green is complete then we may expect a correction upwards for wave (iv) green which may last one to a few sessions. It should find resistance about the upper edge of the smaller green parallel channel. At that stage the invalidation point may move down to the low of wave (i) green at 1,298.90.
As price moves lower keep redrawing the green parallel channel. Draw the first trend line from the lows of (i) green to wherever wave (iii) green ends, then place a parallel copy upon the high of (ii) green.
At this stage while wave (iii) green is incomplete the invalidation point must remain at its start. No second wave correction within wave (iii) green may move beyond the start of its first wave. This wave count is invalidated with movement above 1,319.74.
Alternate Daily Wave Count.
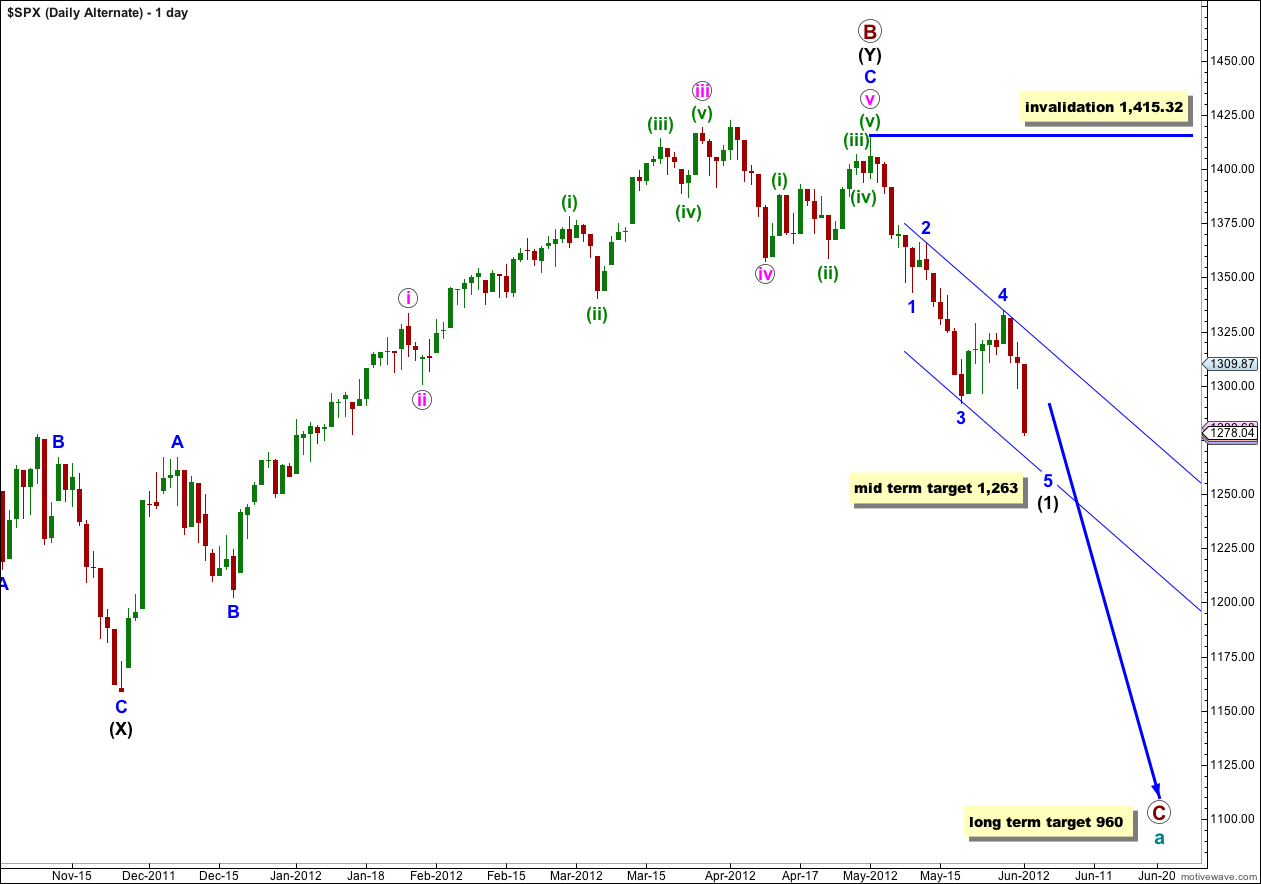
Primary wave B may have ended at 1,415.32 with a fifth wave truncation. The truncation reduces the probability of this alternate.
If primary wave C has more recently begun then it is probably within wave (1) black.
When wave (1) black is complete this alternate would expect a second wave correction for wave (2) black. Wave (2) black can move right up to, but not above, 1,415.32.
At that stage this wave count would diverge from our main wave count. The price point which differentiates the two is 1,357.38. The main wave count would not allow movement above that price point and this alternate would see it as reasonably likely. If price did move above 1,357.38 the main wave count would be invalidated and this alternate would be our sole wave count.
At this stage this alternate does not differ in its expectation of what should happen next. This alternate requires further downwards movement to complete the five wave impulsive structure of wave (1) black. I have recalculated the mid term target for this alternate wave count: at 1,263 wave 5 blue would reach equality with wave 1 blue. If price keeps falling through this first target or if it gets there and the structure is incomplete, the next calculated target would be 1,218 where wave 5 blue would be extended and would be 1.618 the length of wave 1 blue.