Movement below 1,336.61 early in Tuesday’s session invalidated our main hourly wave count and confirmed our alternate. At that stage the target for expected downwards movement was 1,329 for the session. The S&P 500 reached to 1,328.41, just 0.59 points short of our target.
Today’s analysis continues with the same single daily wave count and two hourly wave counts. If the main hourly wave count is invalidated we have an alternate to use. Because the alternate has a low probability it should only be used if the main wave count is invalidated.
Click on the charts below to enlarge.
It looks highly likely that we have recently seen a very large trend change on the S&P 500 and a new downwards trend, to last months, has begun.
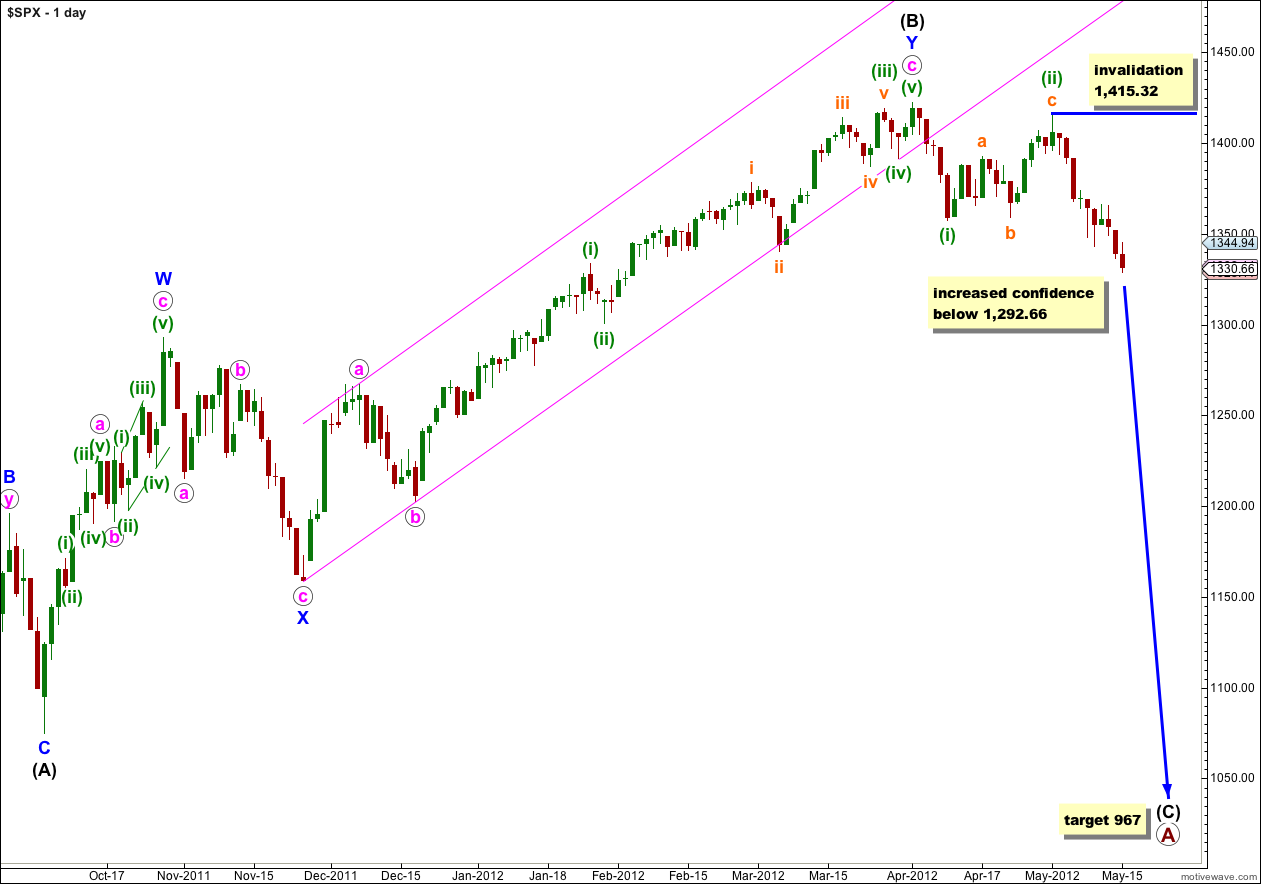
At primary degree wave A is an expanded flat correction. Wave (A) black within it subdivides into a three, and wave (B) black is over 105% of wave (A) black at 123%. The minimum requirements for an expanded flat are met. We should expect wave (C) black to subdivide into a five and move price substantially beyond the end of wave (A) black at 1,074.77.
At 967 wave (C) black would reach 1.618 the length of wave (A) black. If price continues through this first target, or it gets there and the structure is incomplete, then our second (less likely) target is at 685 where wave (C) black would reach 2.618 the length of wave (A) black.
Wave (A) black lasted 4 months. Wave (B) black lasted 6 months. We may expect wave (C) black to last at least 4 months, if not longer.
Within wave (iii) green no second wave correction may move beyond the start of the first wave. This wave count is invalidated with movement above 1,415.32.
When price falls below 1,292.66 then the upwards movement labeled (B) black cannot be a developing five up and it would be confirmed as a completed three. This would add further confidence to the trend change and expectation for wave (C) black to reach targets.
Main Hourly Wave Count.
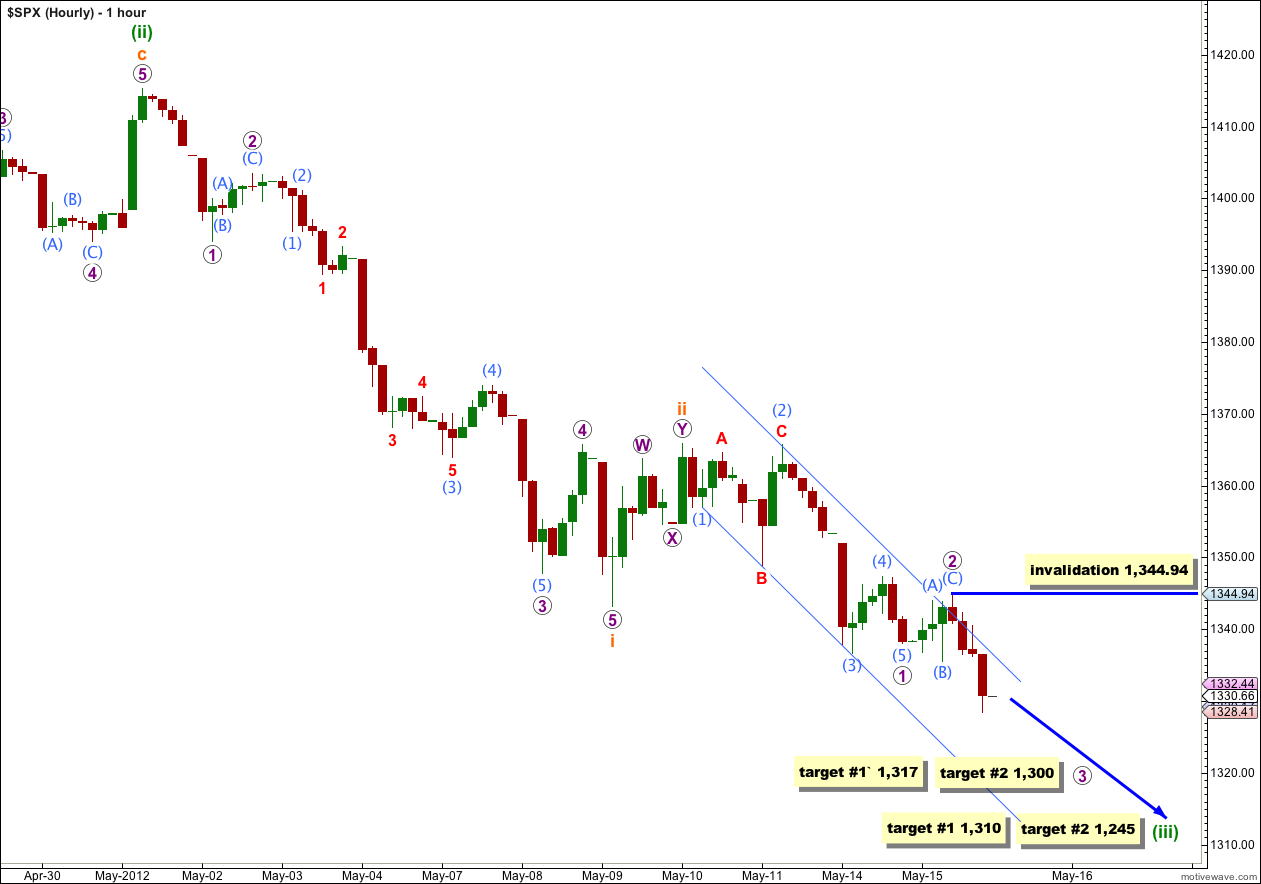
Wave 1 purple must have ended with a slightly truncated fifth wave.
Ratios within wave 1 purple are: wave (3) aqua has no Fibonacci ratio to wave (1) aqua, and wave (5) aqua is just 0.39 points longer than equality with wave (1) aqua.
Wave 2 purple is an expanded flat correction. All the subdivisions fit on the 5 minute chart. Wave (C) aqua is just 0.30 points short of 1.618 the length of wave (A) aqua.
If wave 3 purple within wave iii orange within wave (iii) green downwards has just begun then we should expect to see increasing downwards momentum for the remainder of this week.
Short term targets for wave 3 purple may be met within another one or two sessions. At 1,317 wave 3 purple would reach equality with wave 1 purple. If price continues through this first target then at 1,300 wave 3 purple would reach 1.618 the length of wave 1 purple. The second target has a higher probability.
Mid term targets remain the same. At 1,310 wave (iii) green would reach 1.618 the length of wave (i) green. If price falls through this first target, or gets there and the structure is incomplete, then the second target is at 1,245 where wave (iii) green would reach 2.618 the length of wave (i) green.
Within wave 3 purple no second wave correction may move beyond the start of the first wave. This wave count is invalidated with movement above 1,344.94. If this wave count is invalidated then we may use the alternate below.
Alternate Hourly Wave Count.
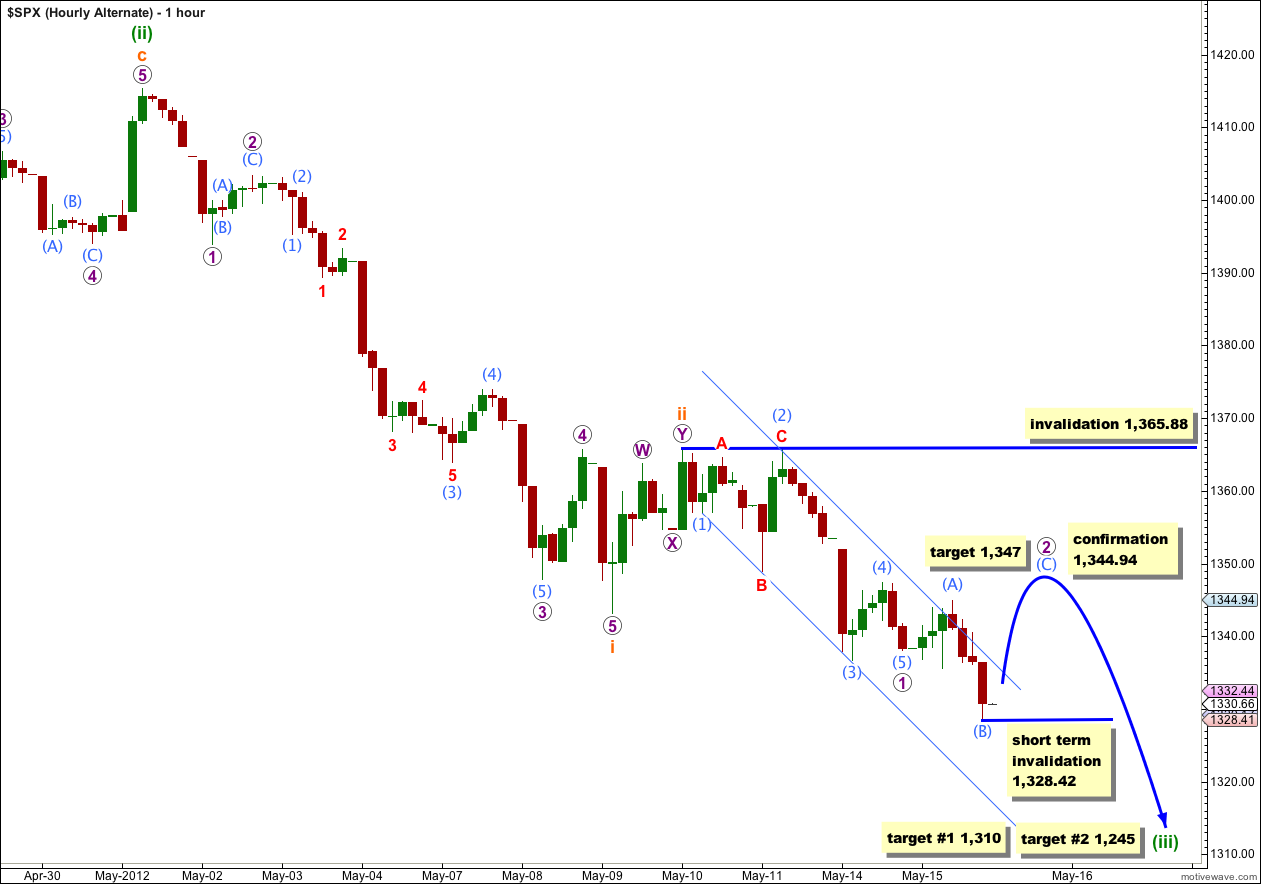
We should only use this alternate if the main wave count is invalidated with upwards movement above 1,344.94.
This alternate has a very low probability because of the length of wave (B) aqua. The maximum common length of a B wave in relation to the A wave of a flat correction is up to 138% and wave (B) aqua is 238% the length of wave (A) aqua. However, at this stage the subdivisions of wave (B) aqua on the 5 minute chart do fit a zigzag.
Within wave (C) aqua no second wave correction may move beyond the start of the first wave. This wave count is invalidated with movement below 1,328.42.
If price does move above 1,344.94 confirming this wave count then we would expect upwards movement to be close to completion. At 1,347 wave (C) aqua would reach 2.618 the length of wave (A) aqua. Thereafter, we would expect strong downwards movement as the middle of a third wave begins.
Mid term targets for this alternate are exactly the same as the main wave count.
Wave 2 purple may not move beyond the start of wave 1 purple. This wave count is invalidated with movement above 1,365.88.


You seem LESS convinced about the drop to 967????? Is that so???
Absolutely not, and I don’t know how you came to that conclusion from this analysis.
I have only one wave count now that the alternate was invalidated. I am expecting overall downwards movement for the next few months to about 967 or below.
Okay, I think I see where you got that idea from. My addition of a price point below which we may have even more confidence in the wave count does not mean that my level of confidence in it has reduced. It just means exactly as I have stated, that below 1,292.66 that my level of confidence in the wave count will be even higher.
There could be an argument for a developing five upwards. I am not charting and publishing this possibility because it has a very low probability and a bunch of problems. That outlying possibility would be invalidated below 1,292.66.
If my level of confidence in the wave count reduces then I will state that, and I will provide a reason.