
Last analysis expected downwards movement for both our main and alternate hourly wave counts to a minimum of 1,345, probably to be reached and passed during Monday’s session.
Monday saw the S&P 500 reach down to 1,336.61 which exactly met our expectations.
For last analysis the direction expected from both our hourly wave counts was the same. For this next analysis the direction expected differs, but the price point which differentiates our two hourly wave counts is very close by.
We still have only one daily wave count and the overall trend expected remains the same. Mid and long term targets are unchanged.
Click on the charts below to enlarge.
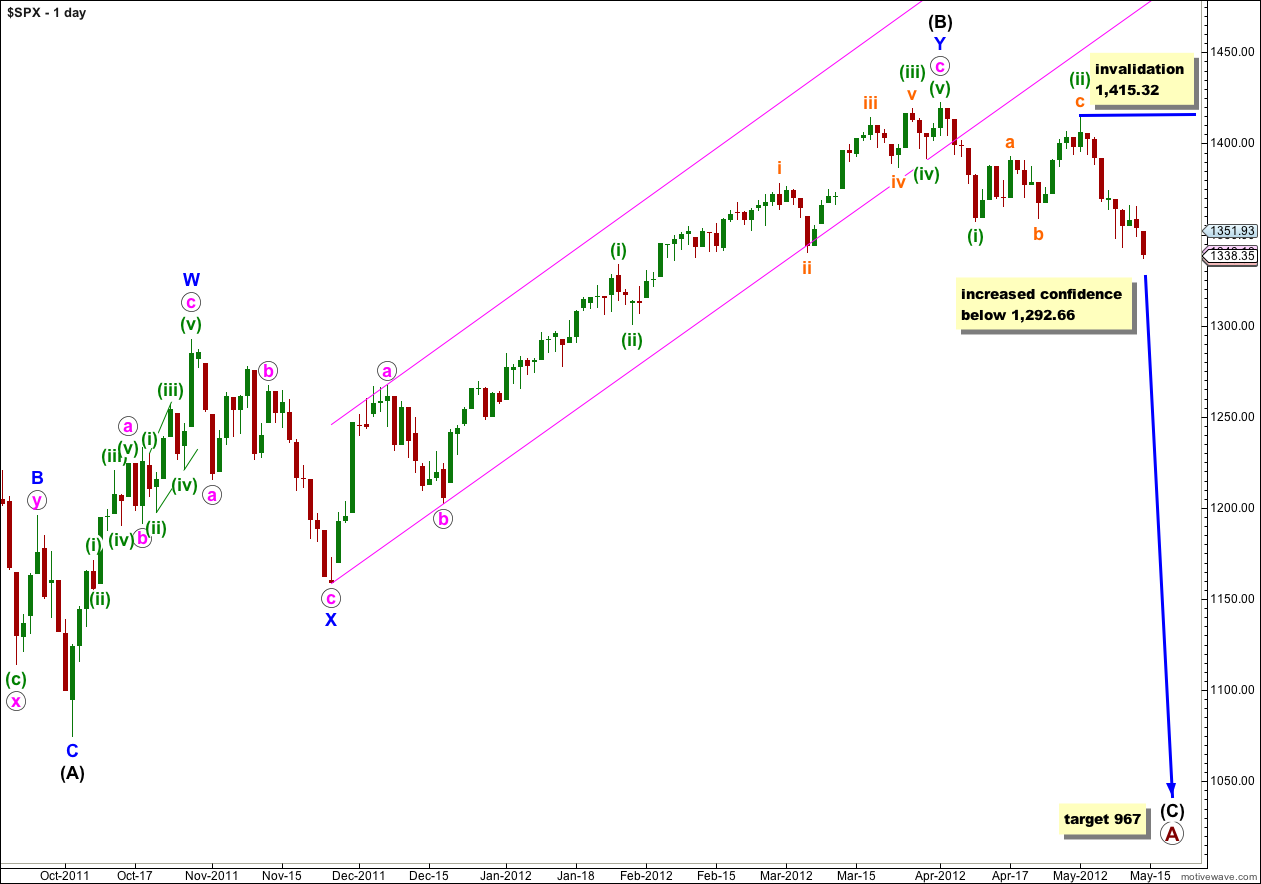
It looks highly likely that we have recently seen a very large trend change on the S&P 500 and a new downwards trend, to last months, has begun.
At primary degree wave A is an expanded flat correction. Wave (A) black within it subdivides into a three, and wave (B) black is over 105% of wave (A) black at 123%. The minimum requirements for an expanded flat are met. We should expect wave (C) black to subdivide into a five and move price substantially beyond the end of wave (A) black at 1,074.77.
At 967 wave (C) black would reach 1.618 the length of wave (A) black. If price continues through this first target, or it gets there and the structure is incomplete, then our second (less likely) target is at 685 where wave (C) black would reach 2.618 the length of wave (A) black.
Wave (A) black lasted 4 months. Wave (B) black lasted 6 months. We may expect wave (C) black to last at least 4 months, if not longer.
Within wave (iii) green no second wave correction may move beyond the start of the first wave. This wave count is invalidated with movement above 1,415.32.
I have added another confirmation point. When price falls below 1,292.66 then the upwards movement labeled (B) black cannot be a developing five up and it would be confirmed as a completed three. This would add further confidence to the trend change and expectation for wave (C) black to reach targets.
Main Hourly Wave Count.
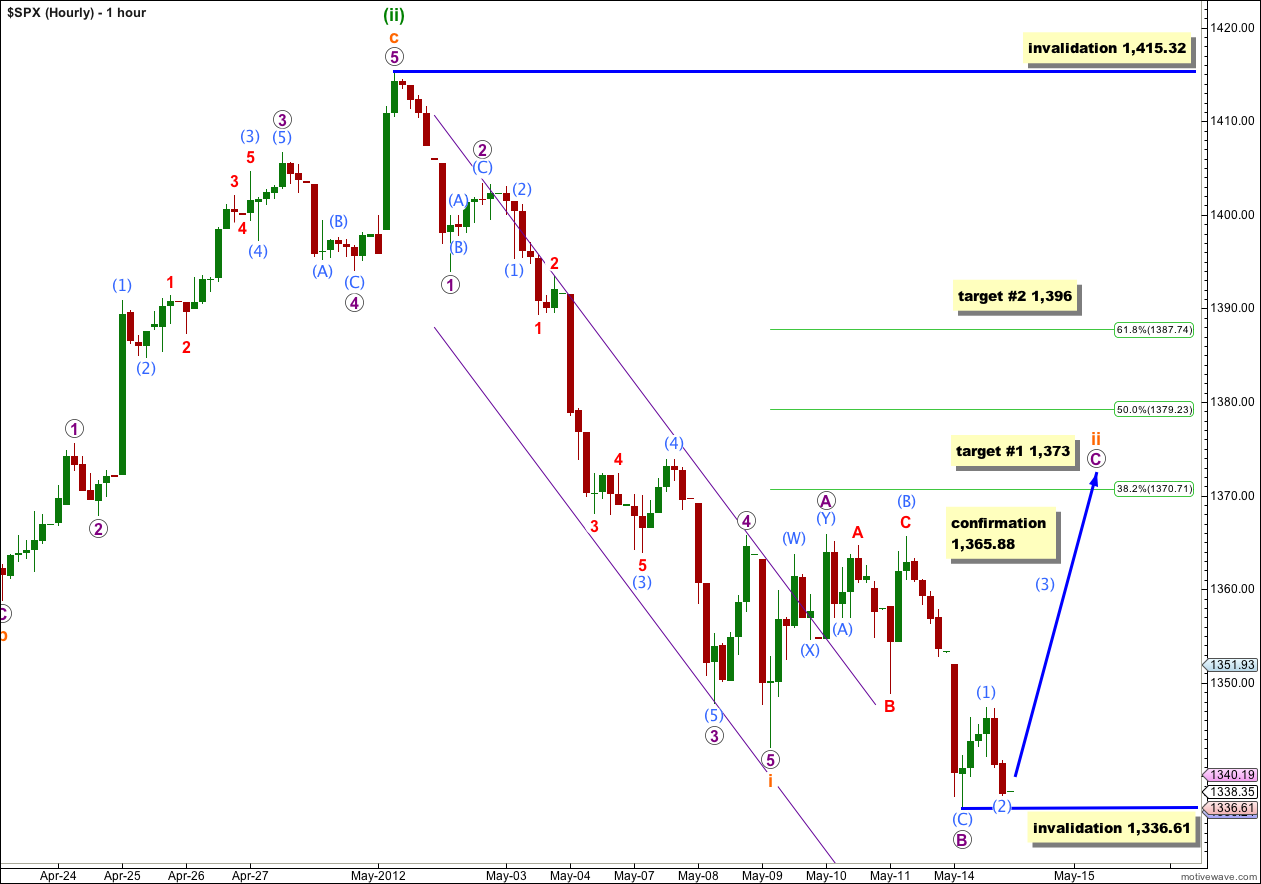
For our main hourly wave count wave B purple within the expanded flat correction for wave ii orange would now be complete. Wave B purple is a 129% correction of wave A purple.
Within wave B purple there is no Fibonacci ratio between waves (A) and (C) aqua.
Wave (C) aqua subdivides nicely into a five wave impulse on the 5 minute chart.
Wave (1) aqua within wave C purple subdivides into a leading diagonal, and wave (2) aqua subdivides into a zigzag which would be complete.
If this wave count is correct then tomorrow we should see strong upwards movement for wave (3) aqua within wave C purple. At 1,366 wave (3) aqua would reach 2.618 the length of wave (1) aqua and this is a possible short term target for tomorrow’s session.
Movement above 1,365.88 would confirm this main wave count as at that point the alternate would be invalidated.
At 1,373 wave C purple would reach 1.618 the length of wave A purple. This is our first more likely target for wave ii orange to end and would see wave ii orange end just over the 0.382 Fibonacci ratio of wave i orange.
If price rises through the first target then the second target is at 1,396 where wave C purple would reach 2.618 the length of wave A purple. This is a less common Fibonacci ratio and this second target has a lower probability.
If we see any further downwards movement tomorrow wave (2) aqua may not move beyond the start of wave (1) aqua. This wave count is invalidated with movement below 1,336.61.
If this main hourly wave count is invalidated with downwards movement then we should use the alternate below.
Alternate Hourly Wave Count.
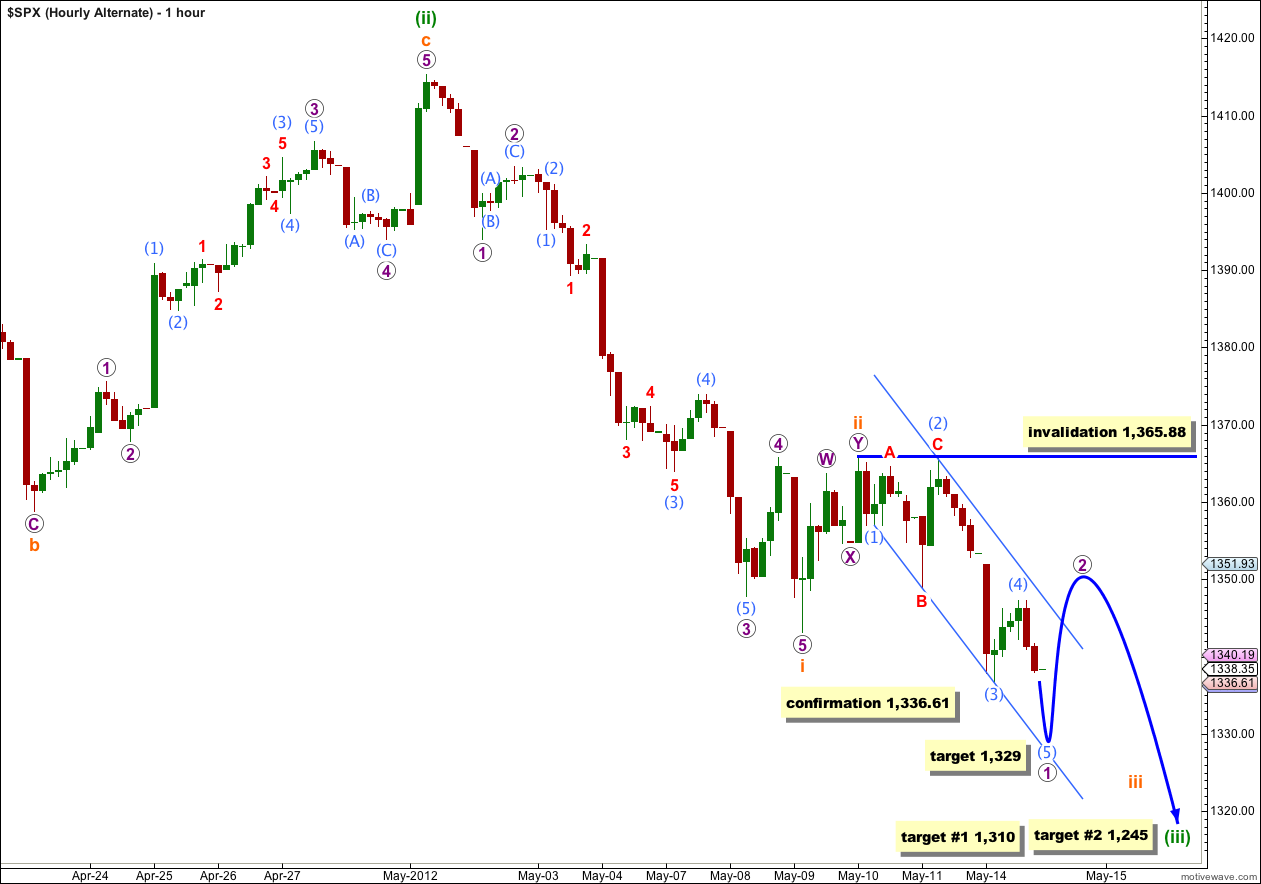
It is possible that wave ii orange was over as a brief shallow double zigzag.
I have moved the degree of labeling within the new impulse downwards all down one degree today. If this is wave iii orange then this would be only wave 1 purple almost complete within the third wave.
At 1,329 wave (5) aqua within wave 1 purple would reach 0.618 the length of wave (3) aqua. Wave (5) aqua may end about the lower edge of the parallel channel drawn here about wave 1 purple using Elliott’s first technique.
Wave 2 purple should breach this small channel.
Thereafter, wave 3 purple downwards should increase in momentum.
Wave 2 purple may not move beyond the start of wave 1 purple. This wave count is invalidated with movement above 1,365.88.
At 1,310 wave (iii) green would reach 1.618 the length of wave (i) green. If price continues down through this first target, or gets there and the structure is incomplete, then the second target is at 1,245 where wave (iii) green would reach 2.618 the length of wave (i) green.