
The S&P 500 moved lower to end the trading week as our last main and alternate wave counts expected. Targets are not yet met. We should expect another correction next week, which could last a couple of days or all week.
Mid and long term targets are unchanged at this stage.
At the end of this week we have much more clarity with price movement below 1,357.38. We have only one daily wave count for the S&P 500, and two hourly wave counts which look at most recent movement slightly differently. The price point which differentiates our hourly wave counts is close by.
Click on the charts below to enlarge.
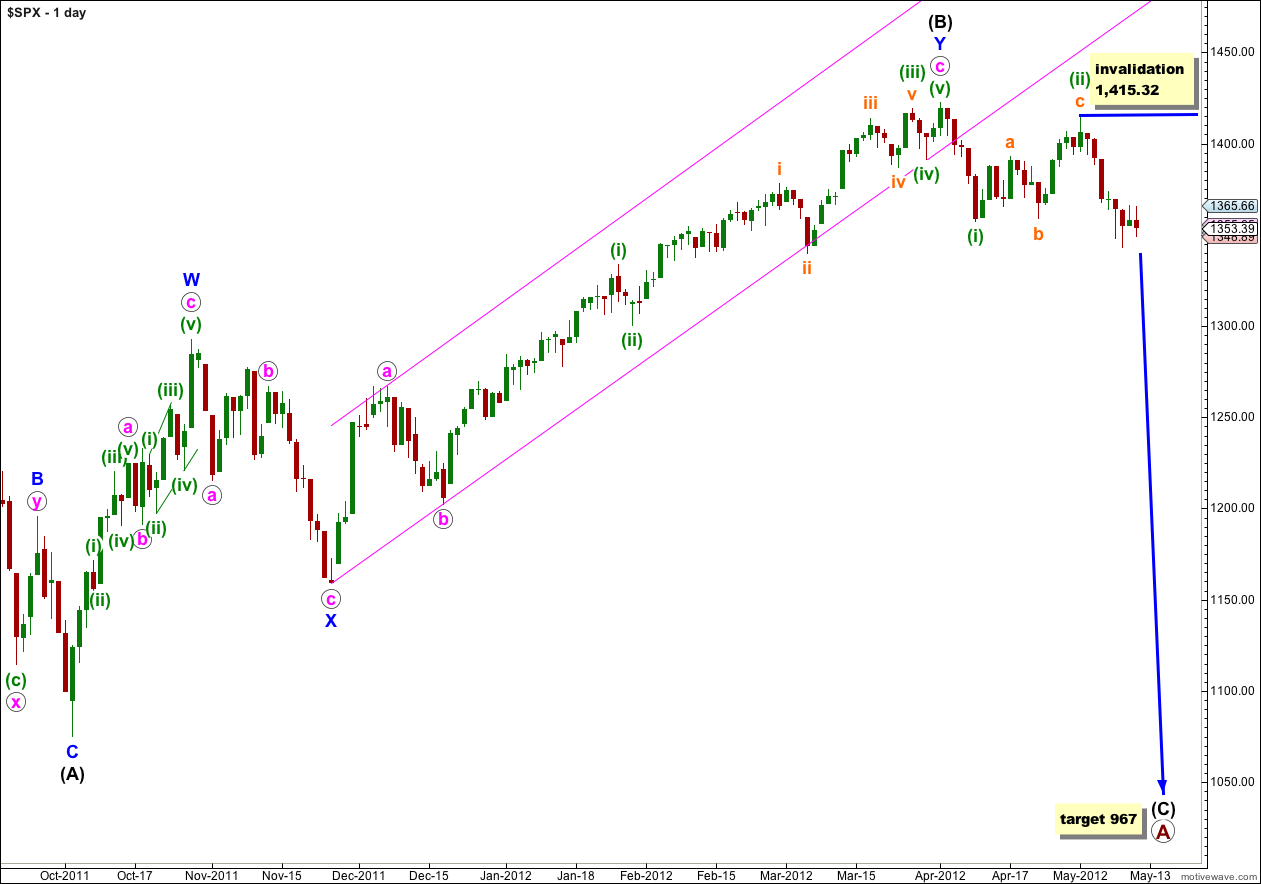
It looks highly likely that we have recently seen a very large trend change on the S&P 500 and a new downwards trend, to last months, has begun.
At primary degree wave A is an expanded flat correction. Wave (A) black within it subdivides into a three, and wave (B) black is over 105% of wave (A) black at 123%. The minimum requirements for an expanded flat are met. We should expect wave (C) black to subdivide into a five and move price substantially beyond the end of wave (A) black at 1,074.77.
At 967 wave (C) black would reach 1.618 the length of wave (A) black. If price continues through this first target, or it gets there and the structure is incomplete, then our second (less likely) target is at 685 where wave (C) black would reach 2.618 the length of wave (A) black.
Wave (A) black lasted 4 months. Wave (B) black lasted 6 months. We may expect wave (C) black to last at least 4 months, if not longer.
If wave (ii) green continues further as a double flat or combination it may not move beyond the start of wave (i) green. This wave count is invalidated with movement above 1,422.38.
Main Hourly Wave Count.
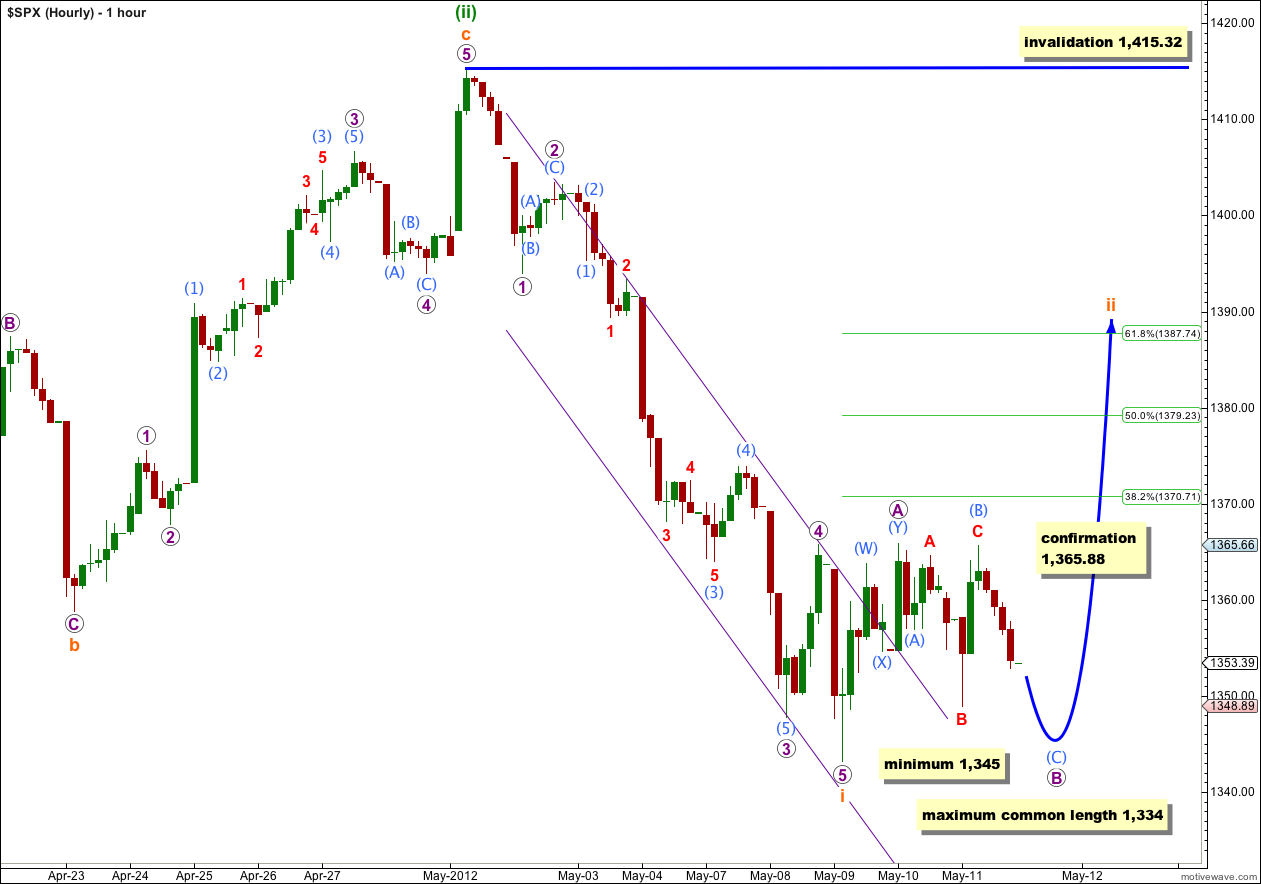
This main hourly wave count agrees with the Dow in terms of the expected direction for the next movement, and for that reason it is my main wave count for the S&P 500. The recent structure on the Dow is extremely clear and I am taking my cue from that wave count.
It is fairly likely that wave ii orange is incomplete. This fits proportionally with wave i orange.
Wave ii orange is here unfolding as a flat correction: wave A purple subdivides into a three, and wave B purple subdivides into a three and must be at least 90% the length of wave A purple reaching down to 1,345. Wave B purple may make a new low below the start of wave A purple at 1,343.13 and there is no lower invalidation point.
Wave B purple within the flat has a maximum length of 100% to 138% the length of wave A purple. This tells us to expect a trend change as most likely before 1,334.
When wave B purple is complete then I can calculate a better target upwards for you for wave C purple. At this stage we may simply expect wave ii orange to reach to about the 0.618 Fibonacci ratio of wave i orange at 1,387. This target may be too high and will probably change.
When we use Elliott’s second channeling technique to draw a channel about wave i orange downwards this channel is clearly breached by upwards movement. This indicates that wave i orange is over and wave ii orange is underway.
Wave ii orange may not move beyond the start of wave i orange. This wave count is invalidated with movement above 1,415.32.
Alternate Hourly Wave Count.
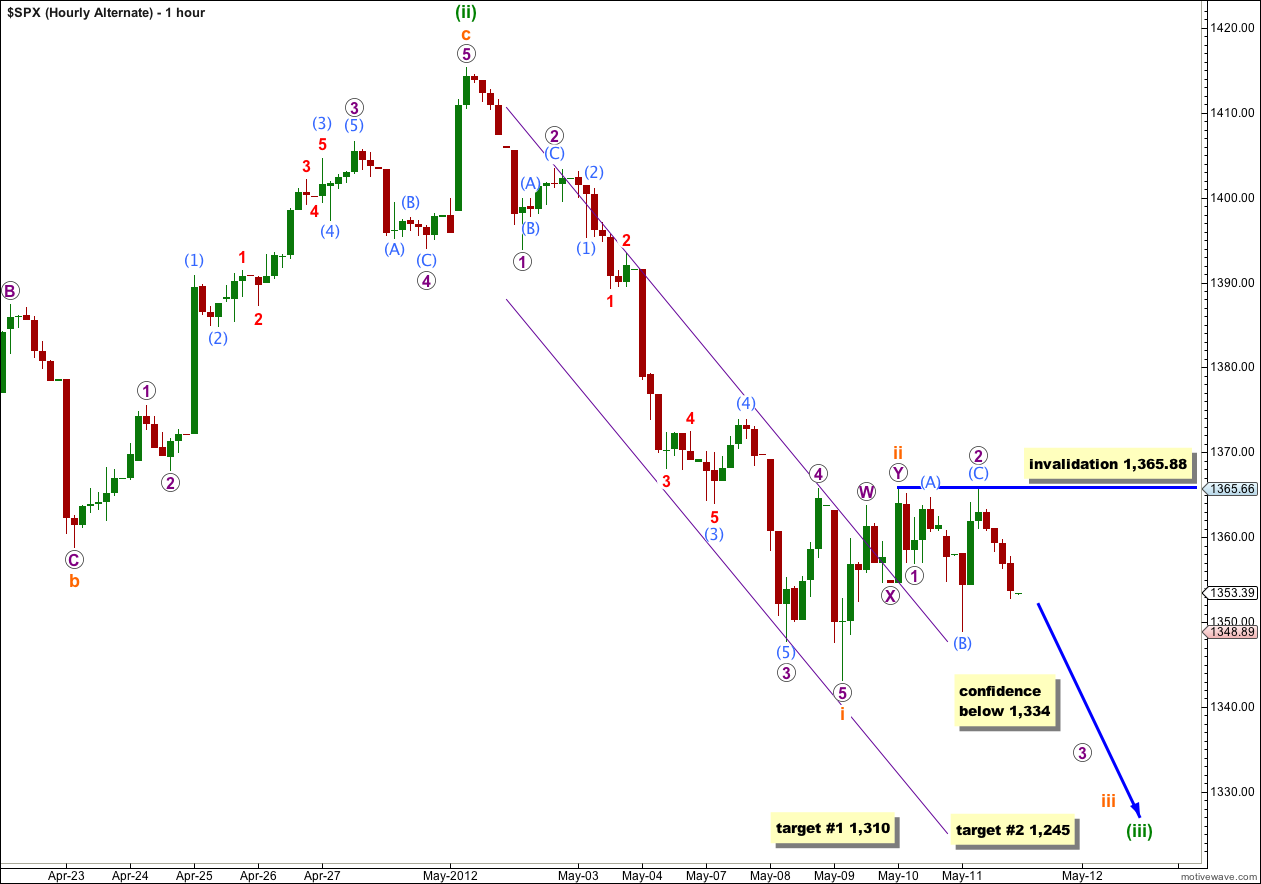
It is possible that wave ii orange is complete if we move the degree of labeling within it down one degree. It would be disproportionate to wave i orange though, and this alternate is out of line with my Dow wave count. It has a lower probability than the main hourly wave count.
If this alternate is correct we should see increasing downwards momentum next week, beginning on Monday.
The main and this alternate both are expecting more downwards movement for at least Monday, thereafter they diverge.
For this alternate at 1,310 wave (iii) green would reach 1.618 the length of wave (i) green. If price reaches that point and the structure is incomplete, or if price keeps falling through this point, then our second target is at 1,245 where wave (iii) green would reach 2.618 the length of wave (i) green.
Within wave iii orange any further extension of wave 2 purple may not move beyond the start of wave 1 purple. This alternate is invalidated with movement above 1,365.88.
What about a possible fourth wave triangle for the S&P 500? This possibility is invalid. The triangle would begin at the low labeled 3 purple within i orange, with wave A at wave 4 purple, wave B at wave 5 purple / i orange, wave C at wave ii orange, wave D at wave (B) aqua and wave E at wave 2 purple. The triangle would be a running contracting triangle, but the violation is wave C at 1,365.88 is a fraction of a point beyond the end of wave A at 1,365.74. This is only 0.14 points but the rule is black and white. Also, this would not be a barrier triangle, which requires the B-D trend line to be essentially flat, not the A-C trend line. For the Dow the triangle is perfect, but it does not work for the S&P 500.