
The Dow has moved lower over the week, but price remains above the point differentiating the two wave counts. I still have two wave counts. The current structure suggests we may not have clarity for a few more days yet, but both my hourly wave counts expect pretty much exactly the same direction for the next few days and the short term targets are identical.
Click on the charts below to enlarge.
Main Wave Count.
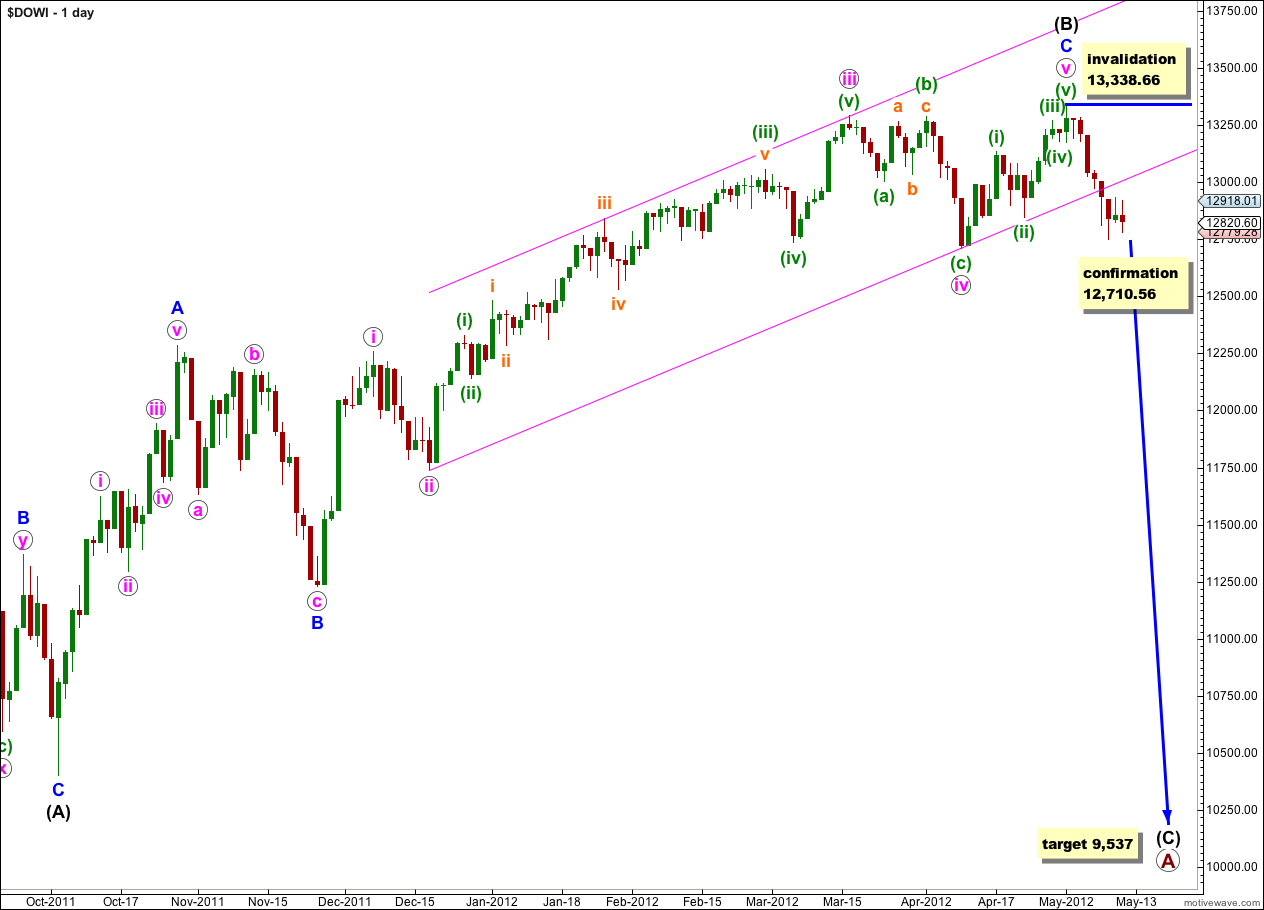
Recent downwards movement from the high labeled here (B) black looks very impulsive, and it does not look corrective. For this reason for the Dow I will swap over the daily wave counts. This wave count has a better fit with recent movement and has a slightly higher probability.
If this wave count is correct then primary wave A expanded flat correction has begun on the final wave (C) black downwards. Expanded flats expect C waves to move substantially beyond the end of A waves, and at 9,537 wave (C) black would achieve this and be 1.618 the length of wave (A) black.
Price movement below 12,710.56 would invalidate the alternate daily wave count and confirm this main wave count.
Within wave (C) black no second wave correction may move beyond the start of the first wave. This wave count is invalidated with movement above 13,338.66.
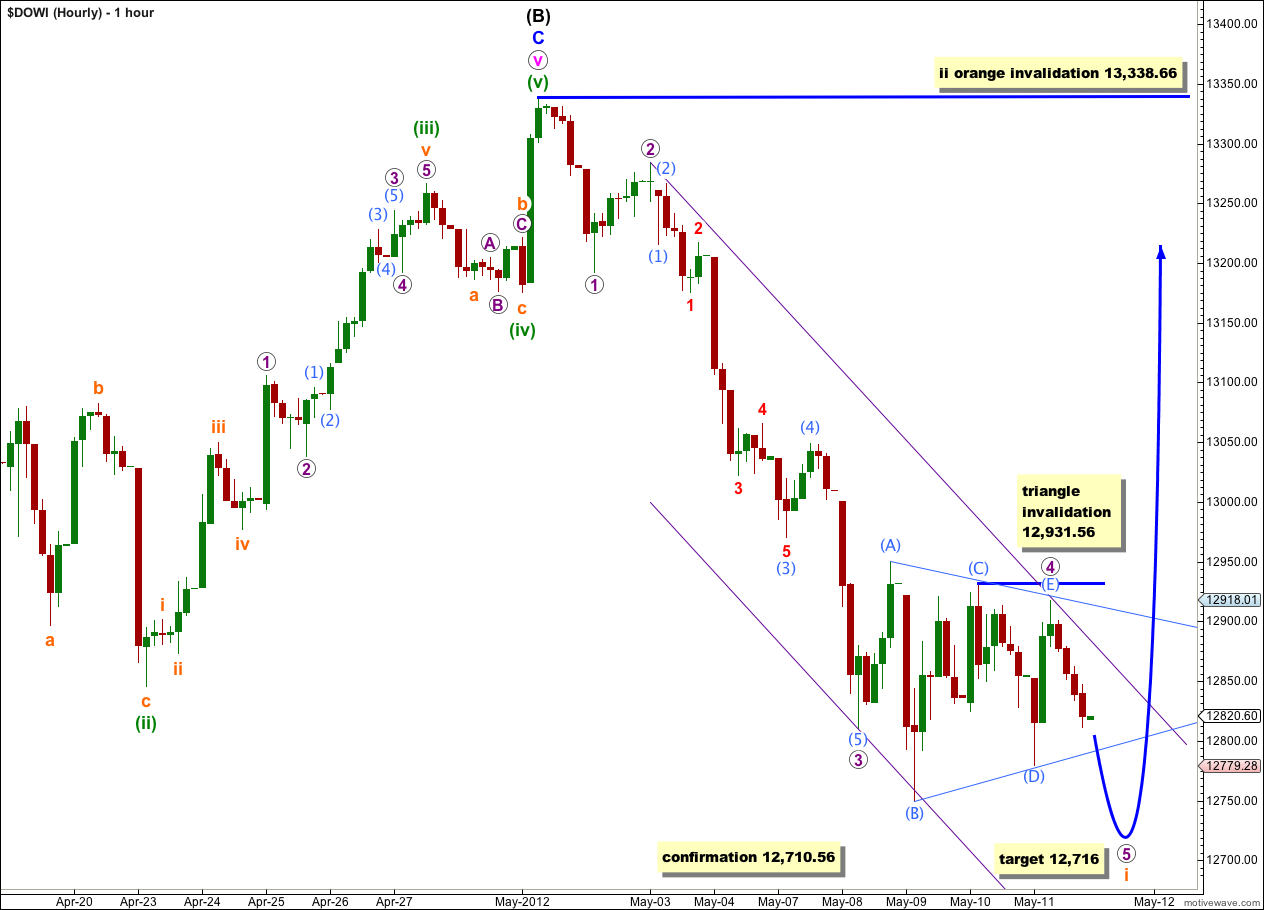
Within recent downwards movement there looks like a very clear contracting running triangle in a fourth wave position.
At this stage I am not certain that wave (E) aqua is complete; on the 5 minute chart this final upwards wave is ambiguous, and looks more like an impulse than a zigzag. This may be only wave A within wave (E) aqua. If wave (E) aqua continues further it may not move beyond the end of wave (C) aqua above 12,931.56.
Movement below the end of wave (D) aqua at 12,779.70 would confirm the end of the triangle.
If the triangle is complete here and wave 5 purple began at 12,917.86 then at 12,716 wave 5 purple would reach equality with the widest part of the triangle. This is a common length for fifth waves following a fourth wave triangle. Unfortunately, this would leave price above 12,710.56 and I hope I am wrong with this target and wave 5 purple ends below this point in order for us to have clarity.
When the triangle is confirmed as complete with movement below 12,779.70 expect price to continue at least a little lower, probably to the target. Thereafter, we shall have a completed five wave impulse downwards. At that stage we may expect a second wave correction for wave ii orange.
Wave ii orange may not move beyond the start of wave i orange. This wave count is invalidated with movement above 13,338.66.
When triangles are this clear and obvious we may have a high level of confidence that the next movement out of the triangle would be sharp and a final movement in the main trend direction, which here is downwards. My only query would be is the triangle complete yet?
Alternate Wave Count.
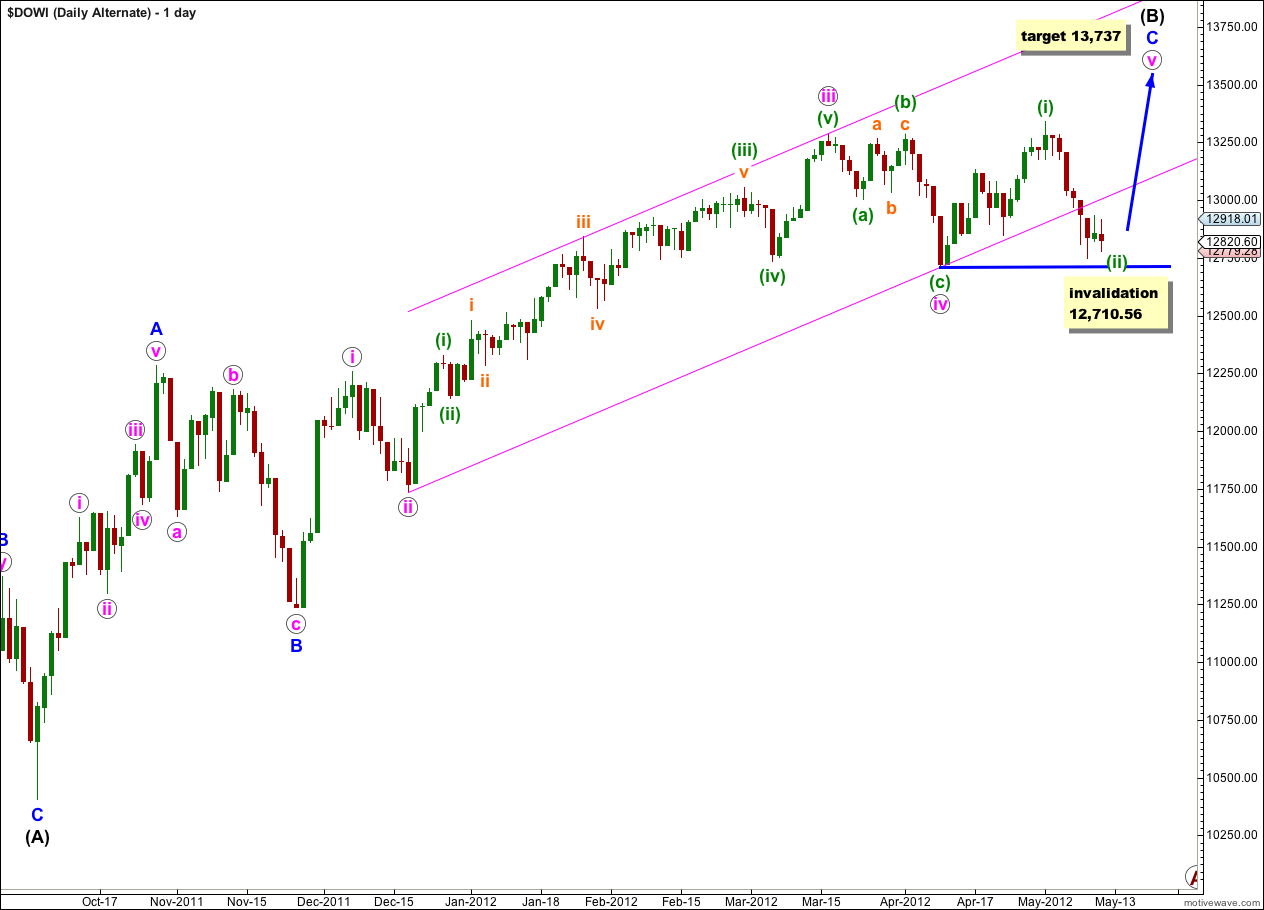
It is still possible, while price remains above 12,710.56, that we may yet see new highs. However, the breach of the parallel channel containing the impulse of wave C blue reduces the probability of this wave count.
If downwards movement for wave (ii) green is a zigzag then it would most likely be an incomplete structure.
When wave (ii) green is complete this wave count would expect upwards movement for a third wave which must make a new high above the end of (i) green at 13,338.66.
At 13,737 wave v pink would reach equality with wave iii pink. At that point wave (B) black would be longer than the longest common length for a B wave within a flat correction, which would be passed at 13,647. This target may be too high and we may see a trend change before this point. As there is further upwards movement to analyse I will recalculate the target at lower wave degrees.
Within wave v pink wave (ii) green may not move beyond the start of wave (i) green. This wave count is invalidated with movement below 12,710.56.
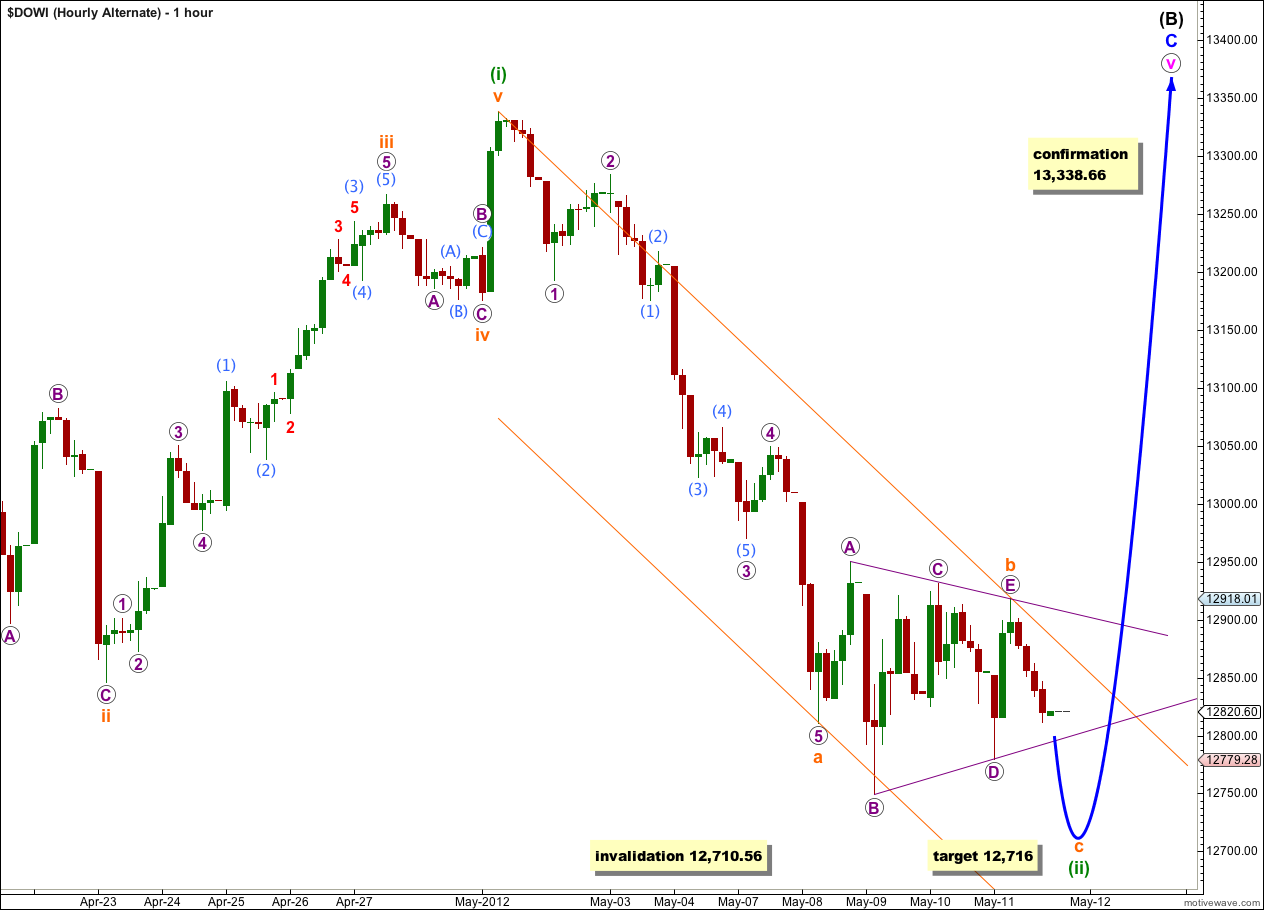
If downwards movement is a zigzag then the triangle would be wave b orange.
We may expect wave c orange to end about 12,716 where it would reach 0.382 the length of wave a orange and would also be equal in length to the widest part of the triangle. This would bring wave (ii) green very close to, but not below, the start of wave (i) green.
We may use Elliott’s channeling technique about this possible zigzag; draw the first trend line from the start of wave a orange to the end of the triangle for wave b orange, create a parallel copy on the low of wave a orange. When this channel is clearly breached by upwards movement then the zigzag is over and the next move upwards is underway.
Movement above 13,338.66 would confirm wave (iii) green as it must move beyond the end of wave (i) green, and at that point the main wave count would be invalidated.