Our main wave count yesterday expected downwards movement. Price moved above the invalidation point on our hourly chart, which was very close by, but remains well below the invalidation point on the daily chart and the wave count remains valid.
Importantly price has found resistance at the lower edge of the parallel channel on the alternate daily chart. We now have a clear trend channel breach.
Click on the charts below to enlarge.
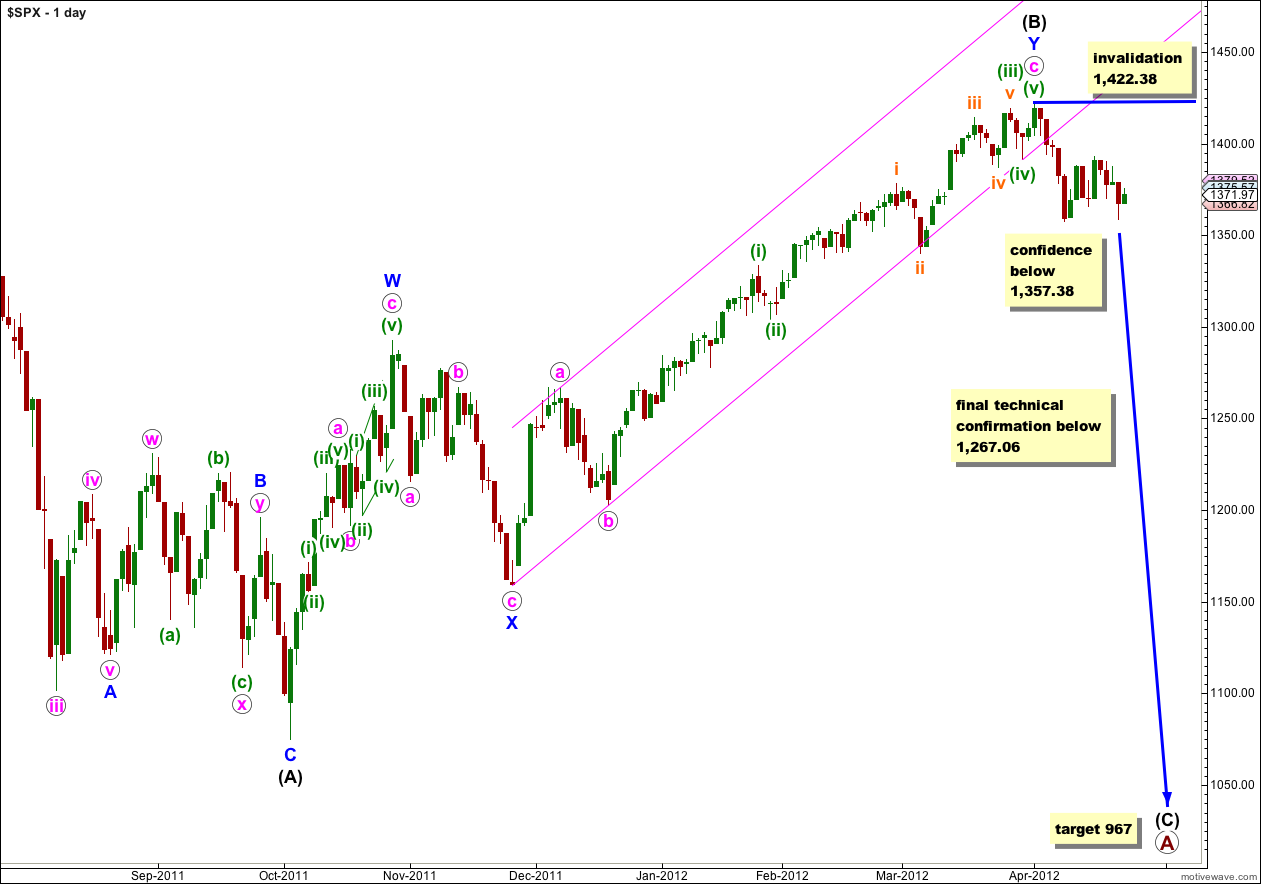
Although price breached the invalidation point on the hourly chart this daily chart still has a very good look. With the parallel channel on the alternate daily chart now breached this main wave count has again increased in probability. I can now say with more confidence that it looks like we have a high in place and a new downwards trend has begun.
The last strong downwards trend labeled here (A) black began in a similar manner. It was not until the structure moved into the third wave at minute degree that momentum to the downside became very strong. At this stage we should expect the trend to be overall downwards, but not that momentum should be especially strong.
At primary degree wave A would be an expanded flat correction because wave (B) black is a 123% correction of wave (A) black. We would expect wave (C) black to most likely reach 1.618 the length of wave (A) black a 967. If price moves through this first target then the next (less likely) target would be where wave (C) black reaches 2.618 the length of wave (A) black at 685.
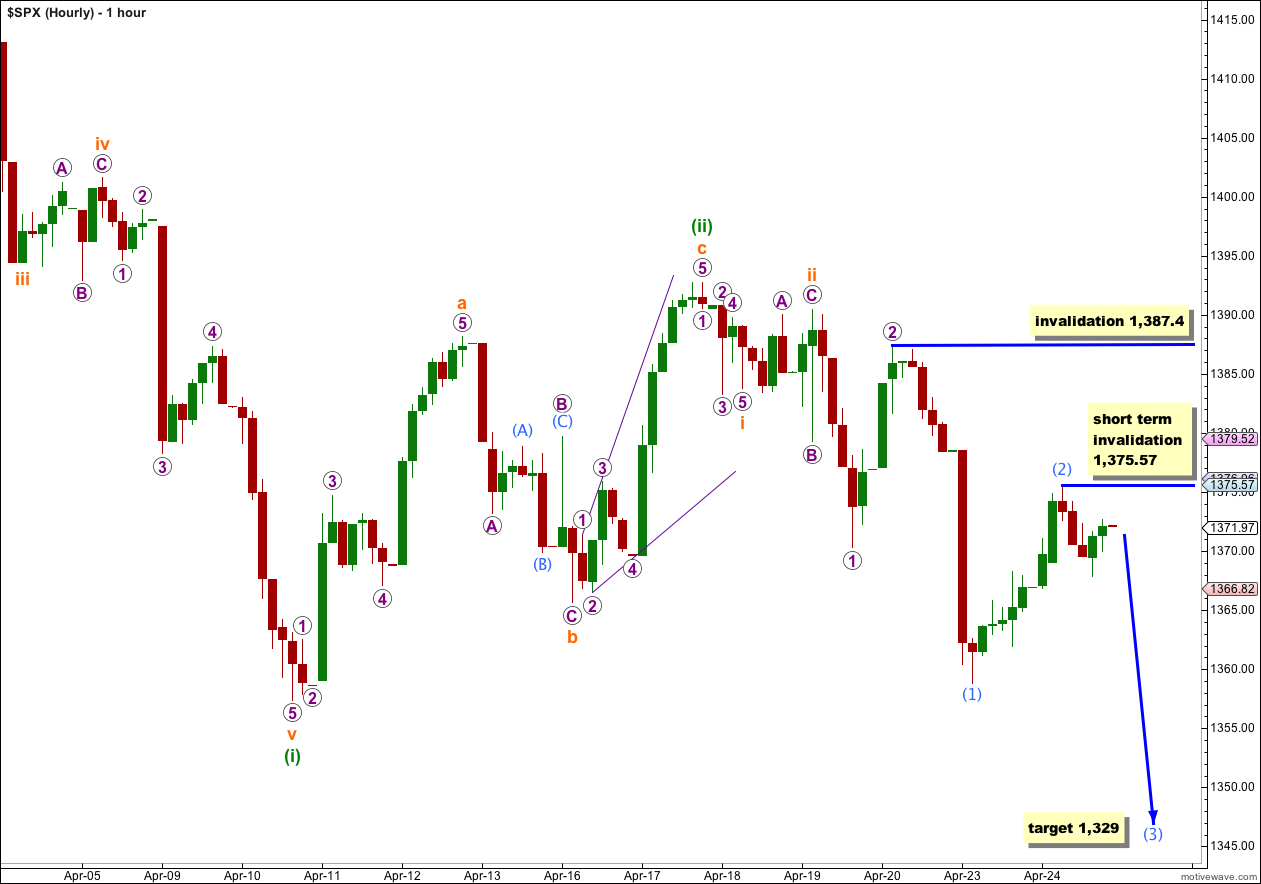
With movement into wave 1 purple price territory above 1,370.3 this upwards wave may not be a fourth wave correction and we must be seeing a series of overlapping first and second waves. When we see this we may liken it to a spring winding up. There is increasing potential energy stored which may be released in explosive downwards movement when the middle of the third wave begins. This should happen this week, and possibly tomorrow.
If wave (2) aqua is complete, and on the 5 minute chart it subdivides perfectly as a zigzag, then tomorrow price should not move above 1,375.57. The small downwards wave from the high labeled (2) aqua subdivides into a perfect five wave impulse on the 5 minute chart, which supports the idea that (2) aqua is complete. We would therefore most likely expect downwards movement tomorrow. At 1,329 wave (3) aqua would reach 1.618 the length of wave (1) aqua. This target may be reached tomorrow.
If price moves above the short term invalidation point at 1,375.57 tomorrow then wave (2) aqua may be extending higher, or the alternate wave count below may be correct. Wave (2) aqua may not move above the start of wave (1) aqua. This wave count is finally invalidated with movement above 1,387.4.
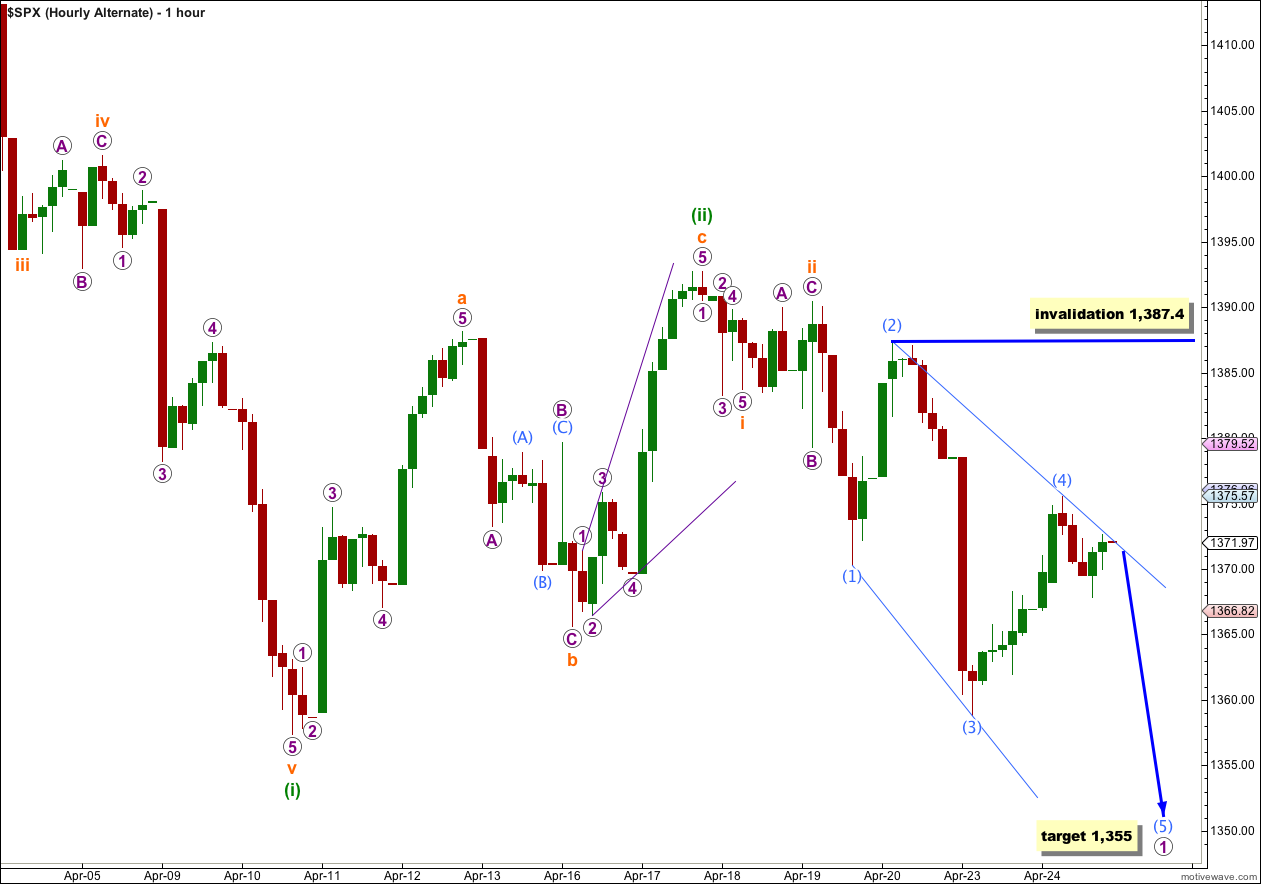
Alternately we may be seeing a leading expanding diagonal unfold in a first wave position. Because leading diagonals are less common than impulses this alternate has a lower probability than the main wave count.
The diagonal should be expanding because wave (3) aqua is longer than wave (1) aqua, but wave (4) aqua is slightly shorter than wave (2) aqua. I have seen many diagonals which do not have expected wave lengths, but conform to the structure in all other respects. Sometimes the third wave is still the longest. This may be what is happening here, but it reduces the probability of this wave count further.
Only if price moves above 1,375.57 tomorrow would I use this wave count. At that stage wave (4) aqua would be longer than wave (2) aqua and the diagonal would have a better look.
Wave (4) aqua may not move beyond the end of wave (2) aqua. This wave count is invalidated with movement above 1,387.4.
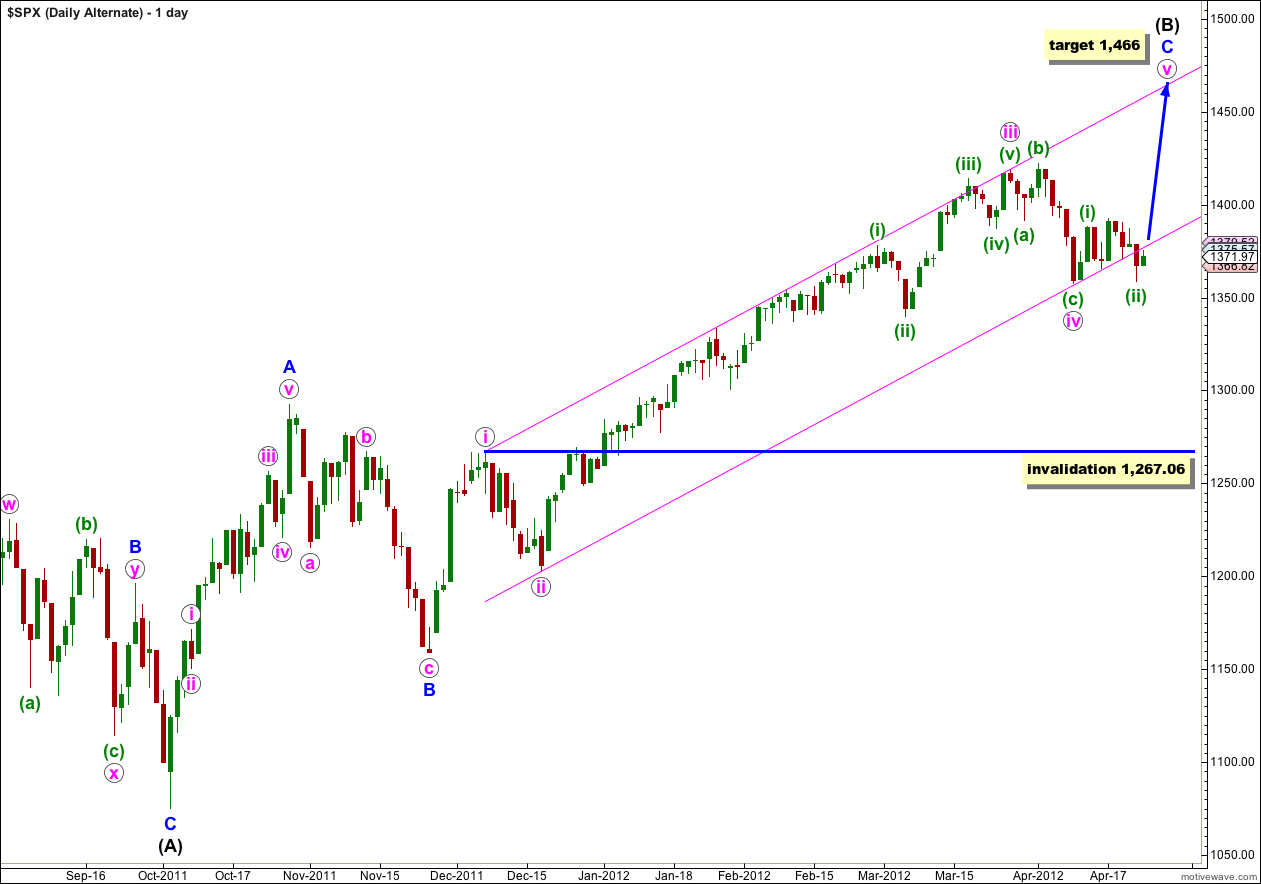
Alternate Daily Wave Count.
We now have a clear trend channel breach. Price has found resistance at the lower edge of this parallel channel. If tomorrow price moves strongly lower this channel breach would be more convincing and I would discard this wave count. At this stage it only has an extremely low probability and this may be the last day this wave count is published.


Sorry not referring to v pink … just minor wave-1 of 5 going to your v pink target of 1466.00
Thank you!
Hey Lara,
Trying to hang in with your alternate daily wave count… dropping Wave-1 goal down a bit to 1401 – 1408.47 let me know what you think later if you have time.
Thank you!!!
if you’re referring to the target for v pink to end the whole structure of (B) black, that target is way too low for the alternate. I’m leaving it at 1,466.
Hi Lara,
I’ve asked this question earlier, in the book, Elliott Wave Principle, Ch 1, Basic Tenets, we read:
“The Wave Principle is governed by mans social nature, and since he has such a nature, its expression generates forms.”
Given that a full 70% to 80% of the trade in the S&P is computer/algo generated, there is no social nature expressed. If this is the case, then it would seem that calculating wave behavior becomes difficult in the extreme.
Given QE’s and Twists driven by the US Fed, and the subsequent activities of the Primary Dealers and Hedge Funds, patterns that SHOULD emerge don’t because of the artificial influences.
These artificial influences drive the momentum algos in ways that are different than humans would react thus skewing EWT in a way that Elliott couldn’t anticipate.
Given the significant influence of algos, suto-traders and non-human trade, how can EWT adapt to be a more useful forecasting tool?
But it is still human beings writing the software. The programmers are going to be guided by traders when writing this software and it will probably have overall strategies built in which would be based upon emotion of the traders.
Only if the majority of the software written was truly devoid of all emotional decisions and completely neutral as to direction of the market would it be true to say that computers are manipulating the market so much that emotion is removed. I believe this is most likely not the case.
As far as the Fed involvement goes, this is completely and totally human emotional involvement. The market will do what the market will do and the Fed will not be able to stop it.