
I had expected downwards movement for the Dow as most likely for this week. This is not what we have seen, but upwards movement looks strongly corrective and price remains below the invalidation point on our main wave count.
If my main wave count is correct then next week should see downwards movement with increasing momentum. If my alternate wave count is correct then next week should see upwards movement, also with increasing momentum. We may use confirmation / invalidation points to work with these two wave counts next week. When price breaks out of a defined range we shall have clarity and only one wave count.
Click on the charts below to enlarge.
Main Wave Count.
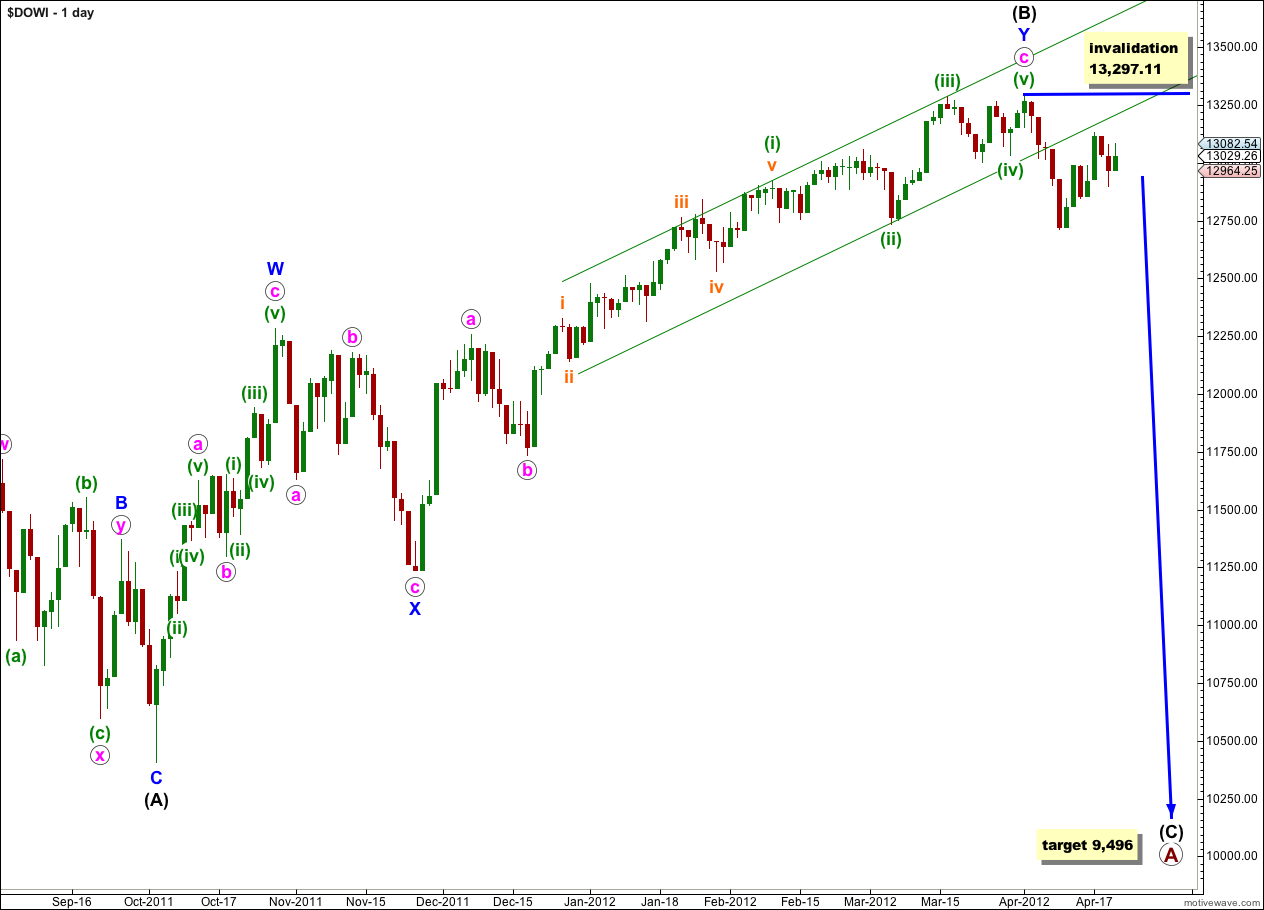
Recent movement upwards, when compared to the first wave down from the high labeled (B) black, looks strongly corrective. It contrasts clearly with downwards movement. This supports this main wave count.
If wave (B) black was a double zigzag structure (which most easily subdivides as) then it is very likely that it was over recently. Wave (B) black is a 123% correction of wave (A) black. Primary wave A is subdividing as an expanded flat which expects a C wave to move substantially beyond the end of wave (A) black. At 9,496 wave (C) black would reach 1.618 the length of wave (A) black.
We may use Elliott’s channeling technique to draw a parallel channel about wave c pink of wave Y blue. This channel is drawn first from the highs of (i) to (iii) green, then a parallel copy is placed upon the low of (ii) green. This channel is clearly breached by downwards movement indicating that we may have seen a trend change.
Within wave (C) black no second wave correction may move beyond the start of the first wave. This wave count is invalidated with movement above 13,297.11.
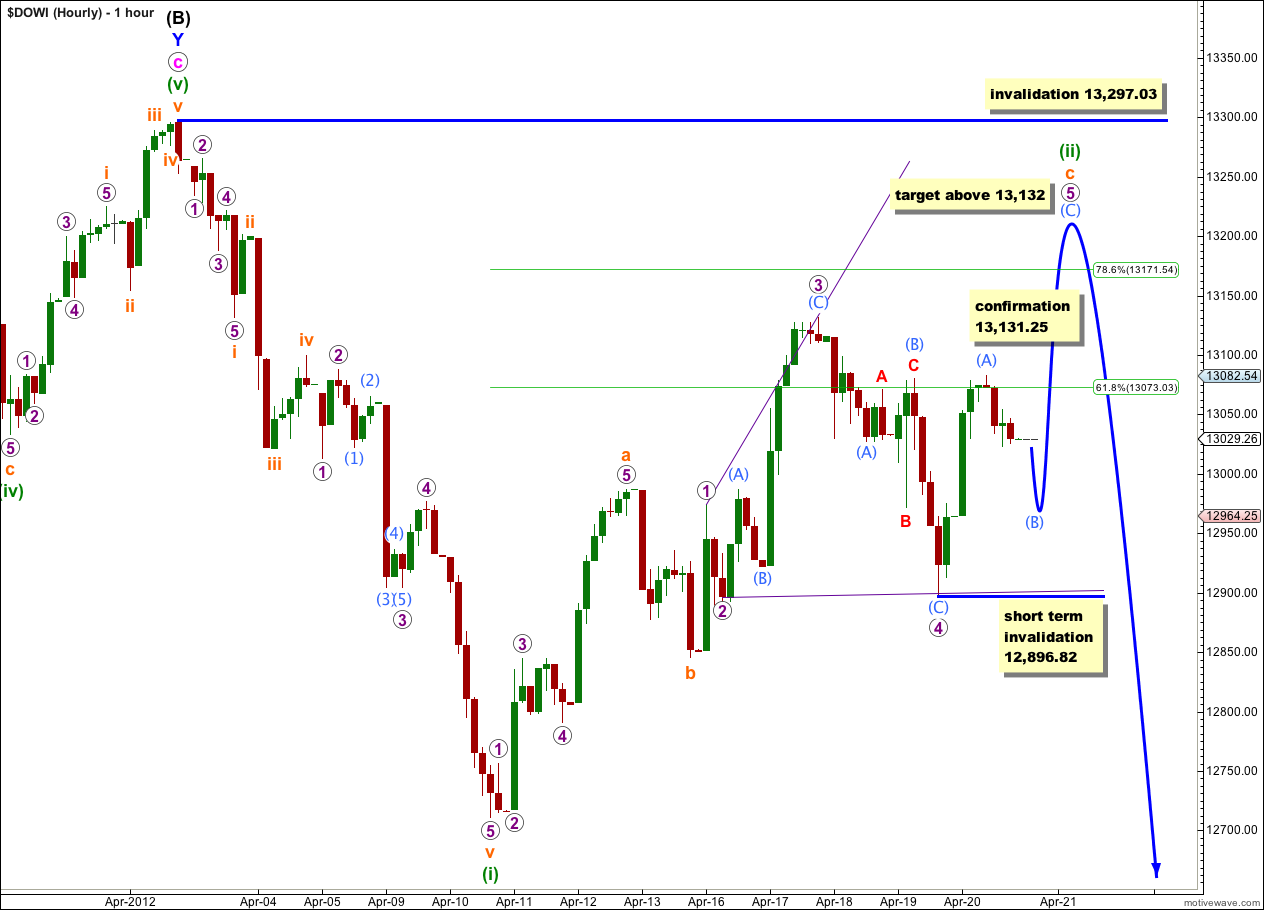
Wave (ii) green, correcting wave (i) green, may not be over and may be finishing an ending expanding diagonal for wave c orange.
This diagonal structure meets all rules for an expanding diagonal, so far. Wave 5 purple should be at least as long as wave 3 purple, and probably at least a little longer. This would see it end above 13,132 where it would reach equality with wave 3 purple. Waves a and c orange may not have a Fibonacci ratio with each other.
Within the diagonal the final fifth wave is unfolding. This structure must be a zigzag. On the 5 minute chart wave (B) aqua looks incomplete and may move a little lower. In the short term it may not move beyond the start of wave (A) aqua below 12,896.82.
Thereafter wave (C) aqua should subdivide as a five wave structure upwards to end at 13,132 or above.
Wave (ii) green may not move beyond the start of wave (i) green. This wave count is invalidated with movement above 13,297.03.
When wave (ii) green is complete we should see downwards movement for a third wave. Downwards momentum should increase next week.
If price remains above 12,896.82 in the short term and moves above 13,131.25 this main hourly wave count would be confirmed and our alternate below invalidated.
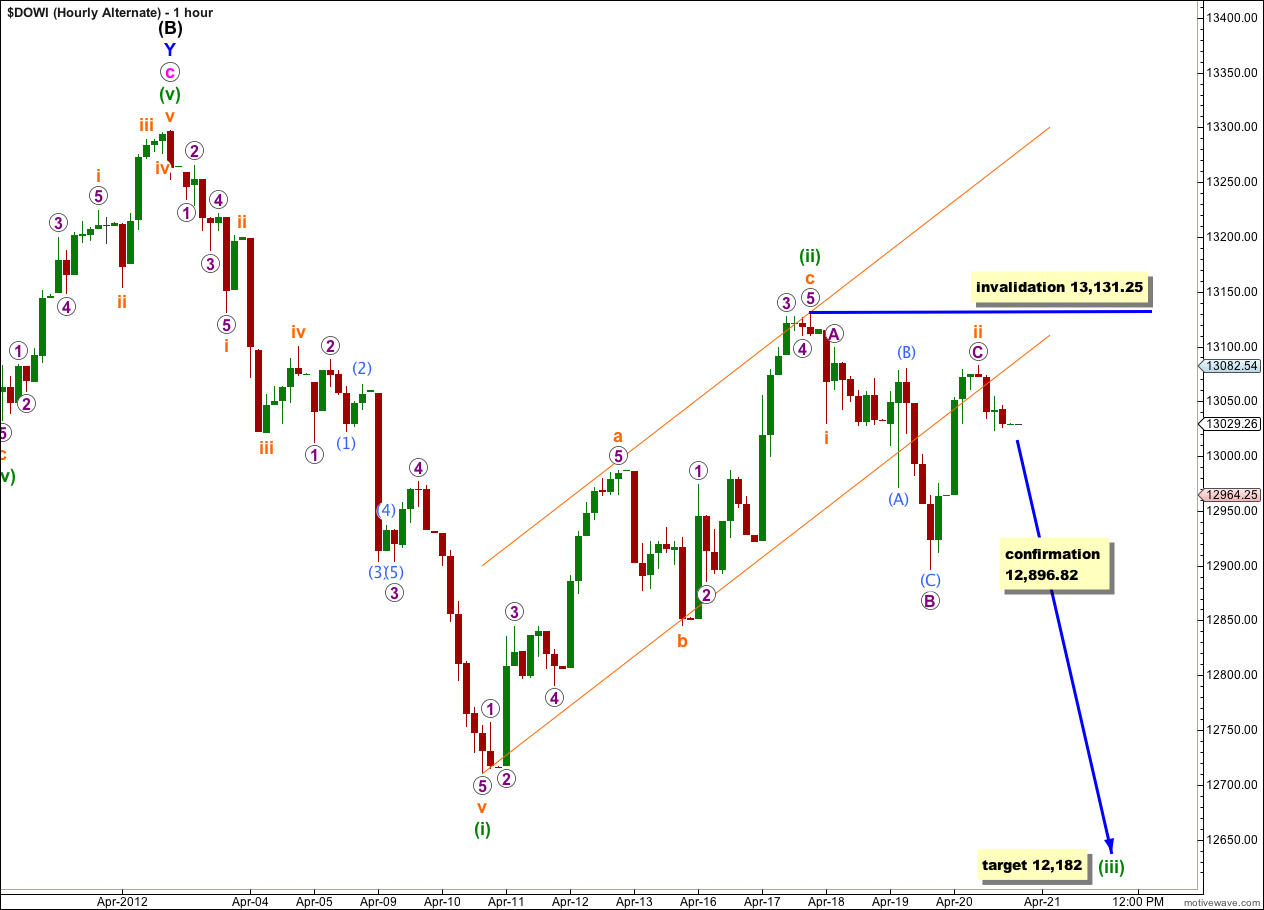
It is possible that wave (ii) green is complete, but this wave count has a lower probability than the main wave count because it includes a rare running flat correction for wave ii orange.
The subdivisions within wave ii orange fit neatly on the 5 minute chart, and this is why I am considering this possible alternate.
If it is correct then we should see an increase in downwards momentum early next week as the third wave of iii orange within a third wave of (iii) green unfolds.
Wave ii orange may not move beyond the start of wave i orange. This wave count is invalidated with movement above 13,131.25.
If price remains below 13,131.25 and moves lower below 12,896.82 early next week this alternate hourly wave count will be confirmed and the main wave count would be invalidated. At that stage expect momentum to increase towards 12,182.
Alternate Daily Wave Count.
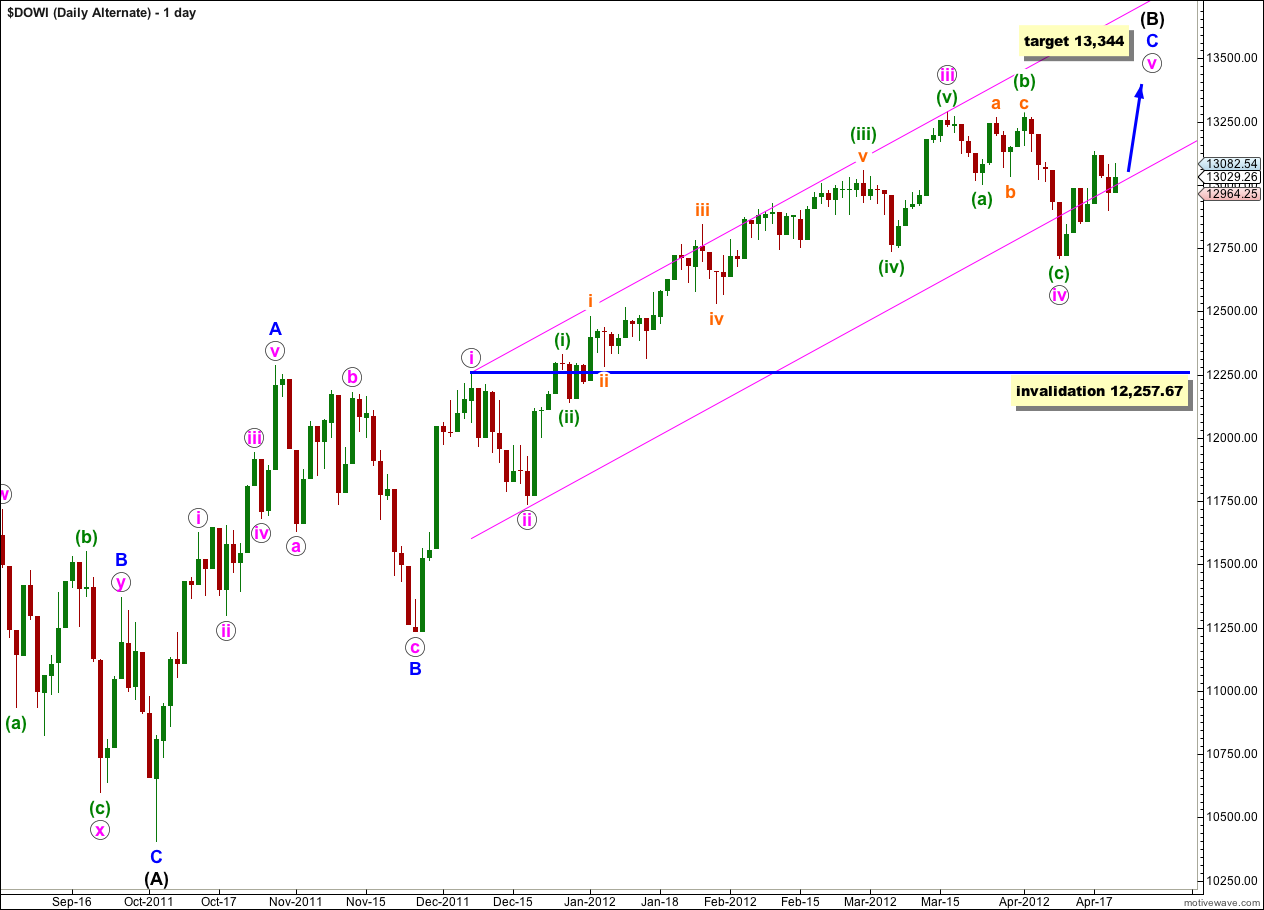
With price remaining mostly within the parallel channel on this alternate wave count it remains a valid possibility and we must accept the risk that the Dow may yet make new highs, before a major trend change. We need to see this channel clearly and strongly breached before we can discard this wave count.
If wave (B) black is a single zigzag structure then wave C blue within it is probably incomplete.
This wave count has a lower probability than the main wave count though because it sees the upwards wave labeled A blue as a five wave impulse. This is possible, but it does have an odd looking third wave within it. It is more satisfactory to see this as a three than a five.
At 13,344 wave v pink would reach 0.618 the length of wave iii pink, and wave (B) black would be less than 138% the length of wave (A) black.
The maximum common length for wave (B) black in relation to wave (A) black is up to 138% at 13,647. If this wave count is correct then we would expect to see a major trend change before price reaches this point.
When we use Elliott’s channeling technique about the upwards wave of C blue it shows quite nicely how upwards movement has been contained, with a fourth wave overshoot of the lower edge of the channel.
However, if price moves back upwards into the channel then this wave count shall remain valid and we must accept the risk that we may yet see new highs.
Wave iv pink may not move into wave i pink price territory. This wave count would be finally technically invalidated with movement below 12,257.67.